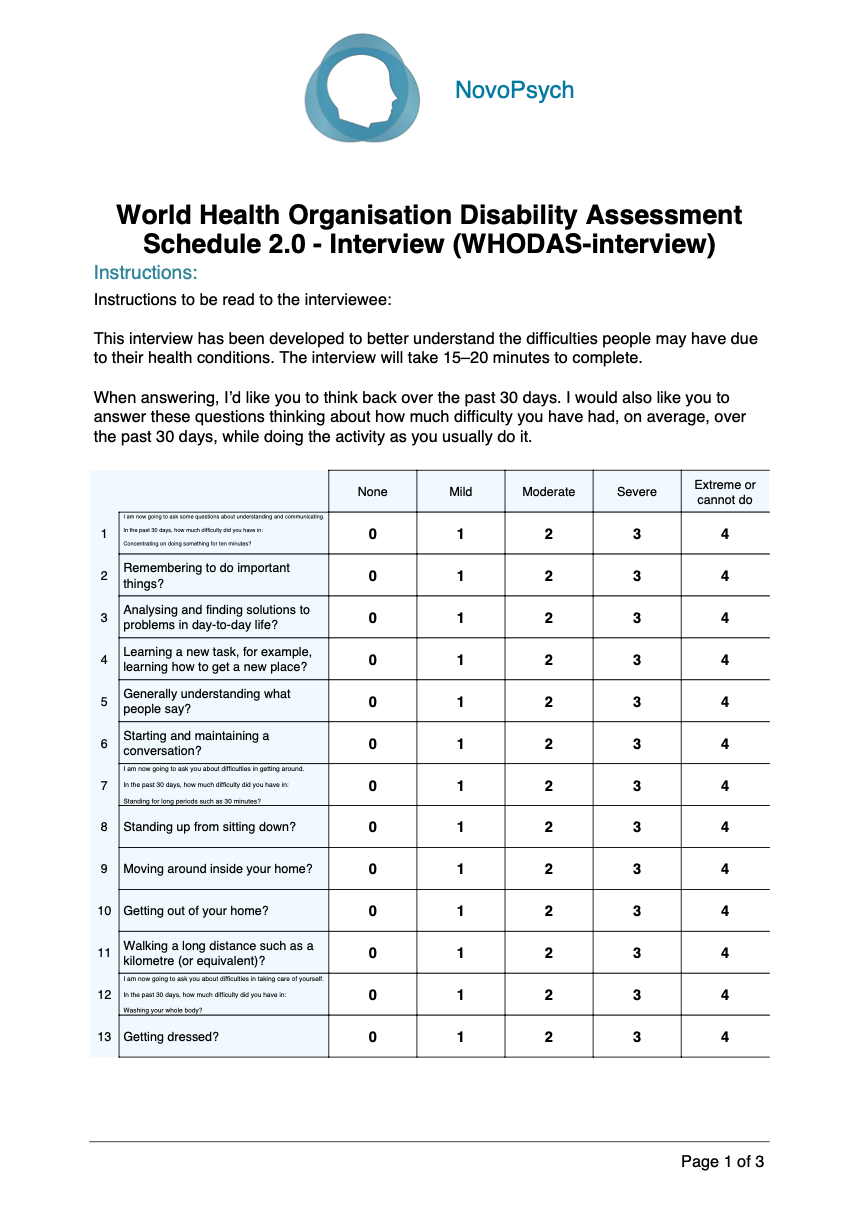
The Perceived Stress Scale (PSS-10; Cohen, Kamarch, & Mermelstein,1983) is a popular tool for measuring psychological stress. It is a self-reported questionnaire that was designed to measure the degree to which situations in one’s life are appraised as stressful. The PSS-10 determines how unpredictable, uncontrollable, and overloaded respondents find their lives. The scale also includes a number of direct queries about current levels of experienced stress. The PSS was designed for use in community samples with at least some high school education. The assessed items are general in nature rather than focusing on specific events or experiences.
Because levels of appraised stress are influenced by daily hassles, major events, and changes in coping resources, predictive validity of the PSS-10 falls off rapidly after four to eight weeks (Cohen et al., 1983).
Psychometric Properties
There have been three versions of the PSS developed. The original instrument is a 14-item scale (PSS-14) that was developed in English (Cohen et al.,1983), which was subsequently shortened to 10 items (PSS-10) using factor analysis based on data from 2,387 U.S. residents. A four-item PSS (PSS-4) was also introduced (Cohen & Williamson, 1988), but its psychometric properties are questionable (Lee, 2012; Taylor, 2015). According to Cohen’s Laboratory for the Study of Stress, Immunity, and Disease (2021), the PSS is currently translated into 25 languages other than English.
Lee (2012) conducted a review of the psychometric properties of all three versions of the PSS and found that the psychometric properties of the PSS-10 are superior to those of the PSS-14 and PSS-4. The Cronbach’s alpha of the PSS-10 was evaluated at >.70 in all 12 studies in which it was used. The test-retest reliability of the PSS-10 was assessed in four studies, and met the criterion of >.70 in all cases. The criterion validity of PSS-10 was evaluated and it was strongly correlated with the mental component of health status as measured by the Medical Outcomes Study – Short Form 36 (Ware, Snow, Kosinski, & Grandek, 1993). The PSS was either moderately or strongly correlated with the hypothesised emotional variables, such as depression or anxiety, as measured using the Center for Epidemiologic Studies Depression Scale (Radloff, 1977), Inventory to Diagnose Depression (Zimmerman & Coryell, 1987), Beck Depression Inventory (Beck, Steer, & Garbin, 1988), Hospital Anxiety and Depression Scale (Zigmond & Snaith, 1983), State-Trait Anxiety Inventory (Spielberger, 1983), General Health Questionnaire (Goldberg & Williams, 1991), Edinburgh Postnatal Depression Scale (Cox, Holden, & Sagovsky,1987), Thai Depression Inventory (Lotrakul & Sukanich, 1999), and Depression Anxiety Stress Scale – 21 (Lyrakos, Arvaniti, Smyrnioti, & Kostopanahiotou, 2011).
A CFA by Taylor (2015) found that a 2 factor model best describes the PSS-10:
- Perceived helplessness
- Lack of self-efficacy
Norms were determined for the total score (by age) for a sample of 2,000 community-based respondents in the US (Cohen & Janicki-Deverts, 2012):
- < 25 years old (mean = 16.78, SD = 6.86)
- 25-34 years old (mean = 17.46, SD = 7.31)
- 35-44 years old (mean = 16.38, SD = 7.07)
- 45-54 years old (mean = 16.94, SD = 7.83)
- 55-64 years old (mean = 14.50, SD = 7.20)
- > 64 years old (mean = 11.09, SD = 6.77)
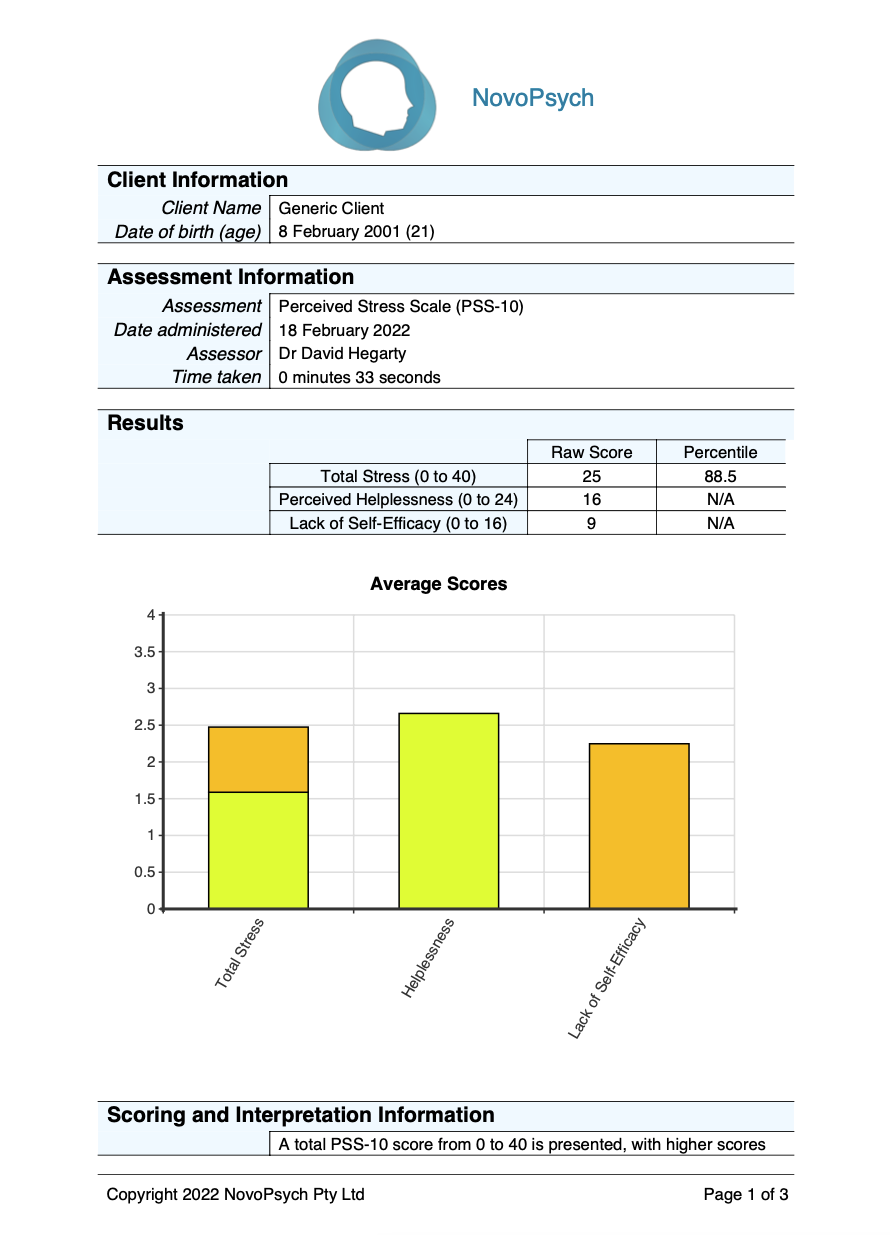
Scoring and Interpretation
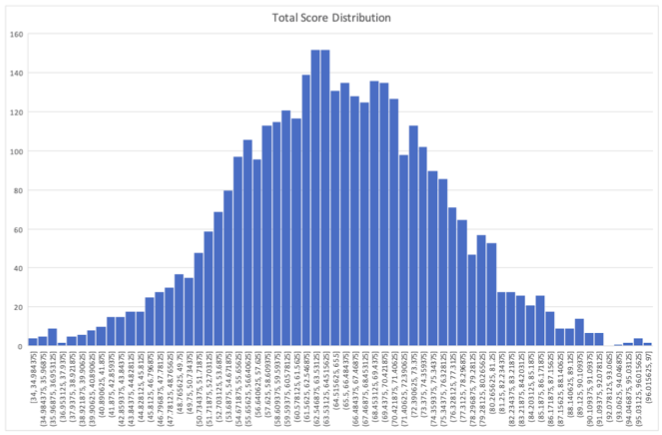
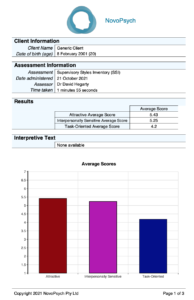
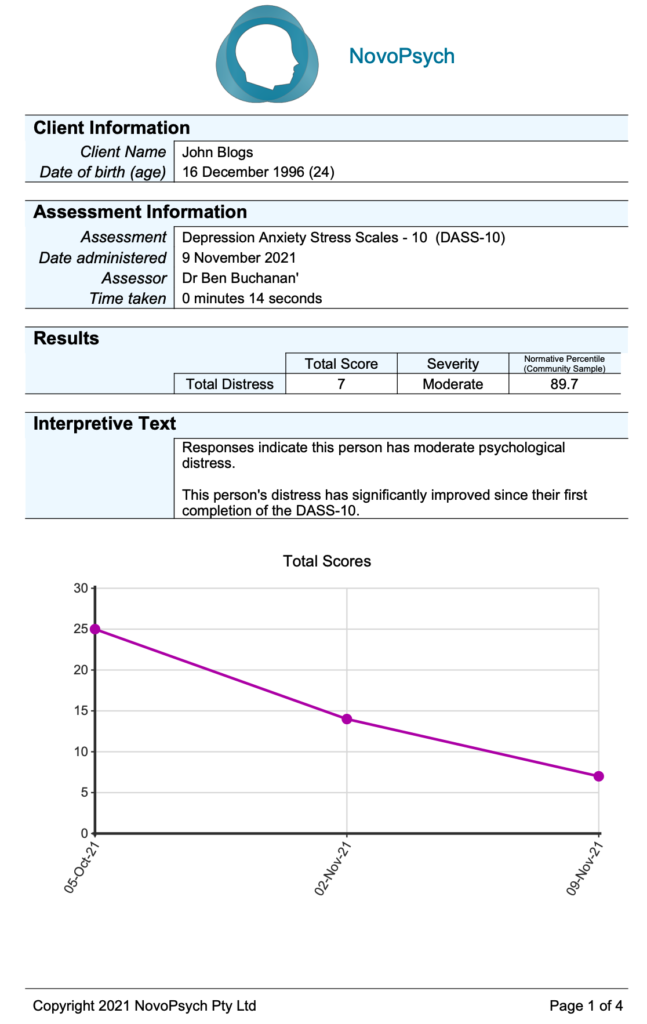
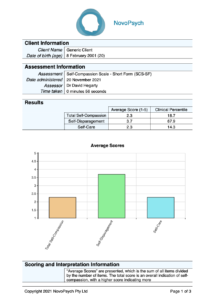
A total PSS-10 score from 0 to 40 is presented, with higher scores representing higher levels of stress. Percentiles are also presented, comparing the results to a community sample (Cohen & Janicki-Deverts, 2012). A percentile of 50 indicates that an individual is experiencing an average level of stress when compared to other members of society. Average scores are also calculated by summing the scores divided by the number of items, and is a useful metric for ascertaining the general level of agreement on the likert scale (where 0 = Never and 4 = Very Often), as well as comparing sub-scale scores using a consistent metric.
There are two subscales in the PSS-10:
- Perceived helplessness (items 1, 2, 3, 6, 9, 10) – measuring an individual’s feelings of a lack of control over their circumstances or their own emotions or reactions.
- Lack of self-efficacy (items 4, 5, 7, 8) – measuring an individual’s perceived inability to handle problems.
Higher levels of psychological stress as measured by the PSS-10 have been associated with elevated markers of biological aging, higher cortisol levels, as well as suppressed immune function, greater infection-induced release of pro-inflammatory cytokines, greater susceptibility to infectious disease, slower wound healing, and higher prostate-specific antigen levels (Cohen & Janicki-Deverts, 2012). Persons who score higher on the PSS also report poorer health practices, such as sleeping fewer hours, skipping breakfast, and consuming greater quantities of alcohol (Cohen &Williamson, 1988).
Developer
Cohen, S., & Williamson, G. (1988). Perceived stress in a probability sample of the United States. In S. Spacapan & S. Oskamp (Eds.), The social psychology of health: Claremont Symposium on applied social psychology. Newbury Park, CA: Sage.
References
Cohen, S., & Janicki-Deverts, D. (2012). Who’s stressed? Distributions of psychological stress in the United States in probability samples from 1983, 2006, and 20091. Journal of Applied Social Psychology, 42(6), 1320–1334. https://doi.org/10.1111/j.1559-1816.2012.00900.x
Cohen, S., Kamarch, T., & Mermelstein, R. (1983). A global measure of perceived stress. Journal of Health and Social Behavior, 24, 385.
Cohen’s Laboratory for the Study of Stress, Immunity and Disease. (2021). Dr.Cohen’s Scales. Retrieved Oct 9, 2021, from https://www.cmu.edu/dietrich/psychology/stress-immunity-disease-lab/scales/index.html
Cohen, S., & Williamson, G. (1988). Perceived stress in a probability sample of the United States. In S. Spacapan, & S. Oskamp (Eds.),The social psychology of health: Claremont symposium on applied social psychology. Newbury Park, CA: Sage.
Lee, E.-H. (2012). Review of the psychometric evidence of the perceived stress scale. Asian Nursing Research, 6(4), 121–127. https://doi.org/10.1016/j.anr.2012.08.004
Taylor, J. M. (2015). Psychometric analysis of the Ten-Item Perceived Stress Scale. Psychological Assessment, 27(1), 90–101. https://doi.org/10.1037/a0038100