Quantcast
Channel: NovoPsych
Viewing all 308 articles
Browse latest View live

How do I delete an assessment?


How to merge two NovoPsych accounts?

How long can I use NovoPsych for free?

How to Introduce Routine Outcome Monitoring to Clients

$
0
0

Many psychologists wonder about the HOW of implementing routine assessments. See Dr Ben Buchanan and Dr Nathan Castle run through how they do it in the first session. 

Depression Anxiety Stress Scales – Short Form (DASS-21)

$
0
0
The DASS-21 is the short form of the DASS-42, a self-report scale designed to measure the negative emotional states of depression, anxiety and stress. As the three scales of the DASS have been shown to have high internal consistency and to yield meaningful discriminations, the scales should meet the needs of both researchers and clinicians who wish to measure current state or change in state over time (e.g., in the course of treatment). This scale is suitable for clinical and non-clinical settings.

Validity

The test was developed using a sample of responses from the comparison of 504 sets of results from a trial by students, taken from a larger sample of 950 first year university student responses. The scores were subsequently checked for validity against outpatient groups including patients suffering from anxiety, depression and other mental disorders. While the test was developed with individuals older than 17 year of age, due to the simplicity of language, there has been no compelling evidence against the use of the scales for comparison against children as young as 12. The DASS-21 has been extensively normed, with data used for interpretive purposes based on a sample of 1794 non-clinical adults (Henrey & Crawford, 2005). Consistent with the DASS-42, the DASS-21 has internal consistency and concurrent validity in acceptable to excellent ranges (Antony et al., 1998).

Interpretation

The DASS is based on a dimensional rather than a categorical conception of psychological disorder. For full interpretive information please purchase the DASS manual at http://www2.psy.unsw.edu.au/groups/dass/order.htm A raw score for the three subscales and the total raw score are given as output. For each of the three subscales percentiles, based on a community sample (n = 1794) are computed. In addition, scores for each subscale are categorised into five severity ranges: normal, mild, moderate, severe and extremely severe. The severity labels are used to describe the full range of scores in the population, so ‘mild’ for example means that the person is above the population mean but probably still below the typical severity of someone seeking help (i.e. it does not mean a mild level of disorder).

Developer

Lovibond, S.H.; Lovibond, P.F. (1995). Manual for the Depression Anxiety Stress Scales (2nd ed.). Sydney: Psychology Foundation (Available from The Psychology Foundation, Room 1005 Mathews Building, University of New South Wales, NSW 2052, Australia

Depression Anxiety Stress Scales – Long Form (DASS-42)

$
0
0
The DASS-42 is a 42 item self-report scale designed to measure the negative emotional states of depression, anxiety and stress. The principal value of the DASS in a clinical setting is to clarify the locus of emotional disturbance, as part of the broader task of clinical assessment. The essential function of the DASS is to assess the severity of the core symptoms of depression, anxiety and stress. As the scales of the DASS have been shown to have high internal consistency and to yield meaningful discriminations in a variety of settings, the scales should meet the needs of both researchers and clinicians who wish to measure current state or change in state over time (e.g., in the course of treatment)

Validity

The test was developed using a sample of responses from the comparison of 504 sets of results from a trial by students, taken from a larger sample of 950 first year university student responses. The test was then normed on a sample of 1044 males and 1870 females aged between 17 and 69 years, across participants of varying backgrounds, including university students, nurses in training and blue and white collared employees of a major airline, bank, railway workshop and naval dockyard. The scores were subsequently checked for validity against outpatient groups including patients suffering from anxiety and depressive disorders, insomniacs, myocardial infarction patients, as well as patients undergoing treatment for sexual, menopausal and depressive disorders. While the test was not normed against samples younger than 17, due to the simplicity of language, there has been no compelling evidence against the use of the scales for comparison against children as young as 12. The reliability scores of the scales in terms of Cronbach’s alpha scores rate the Depression scale at 0.91, the Anxiety scale at 0.84 and the Stress scale at 0.90 in the normative sample. The means and standard deviations for each scale are 6.34 and 6.97 for depression, 4.7 and 4.91 for anxiety and 10.11 and 7.91 for stress, respectively. The mean scores in the normative sample did vary slightly between genders as well as varying by age, though the threshold scores for classifications do not change by these variations. The Depression and Stress scales meet the standard threshold requirement of 0.9 for research, however, the Anxiety scale still meets the 0.7 threshold for clinical applications, and is still close to the 0.9 required for research.

Interpretation

The DASS is based on a dimensional rather than a categorical conception of psychological disorder. The assumption on which the DASS development was based (and which was confirmed by the research data) is that the differences between the depression, the anxiety, and the stress experienced by normal subjects and the clinically disturbed, are essentially differences of degree. The DASS therefore has no direct implications for the allocation of patients to discrete diagnostic categories postulated in classificatory systems such as the DSM and ICD. However, recommended cutoffs for conventional severity labels (normal, moderate, severe) are given in the DASS Manual. For full interpretive information please purchase the DASS manual at http://www2.psy.unsw.edu.au/groups/dass/order.htm A raw score for the three subscales and the total raw score are given as output. Additionally, for each of the three subscales percentiles based on a community sample (n = 2914) are computed.

Developer

Lovibond, S.H.; Lovibond, P.F. (1995). Manual for the Depression Anxiety Stress Scales (2nd ed.). Sydney: Psychology Foundation (Available from The Psychology Foundation, Room 1005 Mathews Building, University of New South Wales, NSW 2052, Australia

Autism Spectrum Screening Questionnaire (ASSQ)

$
0
0
The ASSQ is a 27 question test filled in by parents or teachers of children or adolescents(6 to 17 years of age). It is designed to be an initial screen for Autism spectrum disorders and especially Aspergers syndrome in those with normal IQ or mild intellectual disability. Each question has three possible answers; No, Somewhat, and Yes, and each question has a score from 0 to 2.

Validity

In a sample of 87 boys and 23 girls aged 6 to 17 it was found that Aspergers validation sample scored an average of 25.1 (SD 7.3) (Ehlers, Gillberg, Wing, 1999). These scores were similar to those of the autism spectrum disorder group in the main sample. The subjects in the validation sample were independently diagnosed with Aspergers by a psychologist specializing in the disorder and a child psychiatrist. Moderately and severely mentally retarded children were excluded due to the fact that the ASSQ does not tap features characteristic for such low-functioning subjects. Convergent validity was determined by a Pearson correlation between parent ratings on the ASSQ and Rutter scale was r = .75 n = 107; p < .0001. The mean interrater difference (i.e., between parent and teacher scoring) on the ASSQ (paired t test) was -1.96; t(104) = -2.39; p = .0188. No significant gender differences or differences across normal and intellectually disabled subjects were found regarding mean total score on the ASSQ.

Interpretation

Results consist of a total score and a percentile based on Ebler, Gillberg and Wing (1999) sample of Asperger’s children. High scores indicate that many characteristics of Asperger’s were reported. A percentile of 50 would indicate that this individual had, on average, the same score as the validation sample who were independently diagnosed with Asperger’s. This test is not diagnostic. A cutoff score of 13 was shown to have a true positive rate of 90% and a false positive rate of 22% (Ehlers, Gillberg, Wing, 1999). See developer reference for further details.

Developer

Ehlers, S., Gillberg, C., & Wing, L. (1999). A screening questionnaire for Asperger syndrome and other high-functioning autism spectrum disorders in school age children. Journal of autism and developmental disorders, 29(2), 129-141.

Obsessional Compulsive Inventory- Revised-Parent (ChOCI-R-P)

$
0
0
The ChOCI-R-P is a 32-item, two-part measure assessing the content and severity of compulsions and obsessions in children and adolescents aged 7-17 years. It is completed by a parent rather than being self-report. Part One of the measure looks at the child’s symptoms of compulsions and impairment associated with compulsions, and Part Two addresses the child’s obsessional symptoms and impairment associated with obsessional symptoms.

Validity

Uher, Heyman, Turner and Shafran (2008) evaluated the ChOCI-R-P with a clinical sample of 285 children and adolescents with OCD. The ChOCI-R-P has acceptable internal consistency, and the ChOCI-R-P impairment scales show convergent validity with the similarly-structured CY-BOCS. Scores on the parent version strongly correlated with scores on the self-report version of the measure, at the item and subscale level.

Interpretation

A raw score for each compulsion and obsession subscale is provided as output, along with raw scores for total impairment (range 0-48) and total symptoms (range 0-40). Each subscale and total score are also presented as percentiles based on parents’ responses for a sample of children referred to an OCD clinic (Uher et al., 2008). A percentile of 50 is the average parent reported score for a child with OCD. Higher total impairment scores indicate higher levels of severity/distress related to OCD symptoms, whilst higher total symptoms scores indicate greater complexity and pervasiveness of OCD symptoms. Each subscale is computed as follows: – Compulsion Symptom score: Sum of questions 1 to 10 – Compulsions Impairment score: Sum of questions 14 to 19 – Obsession Symptom score: Sum of questions 20 to 29 – Obsession Impairment score: Sum of questions 33 to 38 – Total symptom score: compulsion symptom score + obsession symptom score – Total impairment score: compulsions severity score + obsession severity score

Developer

Uher, R., Heyman, I., Turner, C. M., & Shafran, R. (2008). Self-, parent-report and interview measures of obsessive–compulsive disorder in children and adolescents. Journal of Anxiety Disorders, 22(6), 979-990. doi:10.1016/j.janxdis.2007.10.001

Eating Attitudes Test-26 (EAT-26)

$
0
0
The EAT-26 is used to identify the presence of “eating disorder risk” based on attitudes, feelings and behaviours related to eating. There are 26 items assessing general eating behaviour and five additional questions assessing risky behaviours. The measure can be used with adolescents and adults and with special risk samples such as athletes. The scale has three subscales: 1. Dieting 2. Bullimia and Food Preoccupation 3. Oral Contr

Validity

While developing the scale Garner et al. (1982) validated it with 160 females with anorexia nervous and compared the results to a sample of 140 healthy females. Thus, the EAT-26 is well-validated with female samples, with scores on the EAT-26 being highly predictive of scores on the original EAT-40. This measure demonstrates high internal consistency (Garner et al., 1982).

Interpretation

Results consist of a total score and three subscales scores: 1) Dieting, 2) Bulimia, 3) Food Preoccupation and Oral Control Higher scores indicating greater risk of an eating disorder and total scores 20 or above are considered to be in the clinical range. In addition to the raw scores the results are presented as a percentiles based on a healthy female sample (n = 140) and a sample of anorexia nervosa patients (n = 160: Garner et al., 1982). A percentile of about 50 is typical in comparison to the anorexia nervosa group for someone suffering from an eating disorder. The four behavioural questions (questions 27, 28, 29, 30 and 31) are not included in the calculation of the above scores, but are major risk factors important to the health of people with an eating disorder.

Developer

Garner, D. M., Olmsted, M. P., Bohr, Y., & Garfinkel, P. E. (1982). The eating attitudes test: Psychometric features and clinical correlates. Psychological Medicine, 12(4), 871-878. doi:10.1017/S0033291700049163.

Mood and Feelings Questionnaire: Parent Report (MFQ-Parent)

$
0
0
The Mood and Feelings Questionnaire (Short Version) – Parent Report is a 13-item measure assessing recent depressive symptomatology in children aged 6-17 years. The MFQ-P is parent-rated and asks the parent to report how their child has been feeling or acting in the past few weeks.

Validity

The MFQ-P shows convergent validity with other measures of child depressive symptomatology, like the Children’s Depression Inventory (CDI) and the Diagnostic Interview Schedule for Children (DISC). The present measure also has high internal consistency and a unidimensional factor structure. The MFQ-P can also discriminate between clinically depressed and non-depressed children. It should be noted that when the MFQ-P score is combined with the self-report version score for the same child, there is better depression status discrimination with the combined score than with either measure alone. The measure was also validated by Rhew et al. (2010) in a sample of parents of 521 sixth grade students with an average age of 11.5. After independently diagnosing the students they found that the MFQ-P was moderately accurate at discriminating depressed and non-depressed children. This study provided data for a non-depressed sample (n = 476) and depressed children sample (n=36).

Interpretation

Scores on the MFQ-P range from 0 to 26, with higher scores indicating greater depressive symptomatology experienced by the child. Data is also presented as percentile ranks that compare scores to parent reports for depressed and non-depressed children (Rhew et al, 2010). Analysis of sensitivity and specificity data saw a cut-off score of 11 (Thapar & McGuffin, 1998). That is, a child who received a rating of 11 or higher from their parent on the MFQ-P is likely to have depression.

Developer

Angold, A., Costello, E. J., Messer, S. C., Pickles, A., Winder, F., & Silver, D. (1995). The development of a short questionnaire for use in epidemiological studies of depression in children and adolescents. International Journal of Methods in Psychiatric Research, 5, 237 – 249.

Mood and Feelings Questionnaire-Self Report (MFQ-Self)

$
0
0
The Mood and Feelings Questionnaire (Short Version) – Self Report is a 13-item measure assessing recent depressive symptomatology in children aged 6-17 years. The MFQ-Self is self-report and asks the child to report how they have been feeling or acting in the past two weeks

Validity

During the development of the measure Angold et al. (1995) reported convergent validity with other measures of child depressive symptomatology, like the Children’s Depression Inventory (CDI) and the Diagnostic Interview Schedule for Children (DISC). The MFQ-Self can discriminate between clinically depressed and non-depressed children in the general population. It should also be noted that the self-report version of the MFQ discriminates depression status better than parent-report, but combining the MFQ-Self with the parent- report score discriminates clinical status better than either measure alone. The present measure has a unidimensional factor structure and high internal consistency. The measure was also validated by Rhew et al. (2010) in a sample of 521 sixth grade students with an average age of 11.5. They conducted interviews with these students and determined that the MSQ-Self was able to discriminate depressed and non-depressed children with moderate accuracy. At a cut point of four, where sensitivity and specificity most closely intersected, the MSQ-Self had a sensitivity of 0.66, and specificity of 0.61. This study also provides the non-depressed sample (n = 476) and depressed children sample (n=36).

Interpretation

Scores on the MFQ-Self range from 0 to 26, with higher scores indicating greater depressive symptomatology experienced by the child. Scores are also presented as percentile ranks according to Rhew’s (et al., 2010) non-depressed sample and a depressed samples. In the original paper detailing the development of the MFQ (Angold et al., 1995), analysis of sensitivity and specificity for cut-off scores cut-off score of 8. Rhew et al. (2010) suggested a lower cut-off score of only 4.

Developer

Angold, A., Costello, E. J., Messer, S. C., Pickles, A., Winder, F., & Silver, D. (1995). The development of a short questionnaire for use in epidemiological studies of depression in children and adolescents. International Journal of Methods in Psychiatric Research, 5, 237 – 249.

Penn State Worry Questionnaire (PSWQ)

$
0
0
The PSWQ is a 16-item self-report scale designed to measure the trait of worry. The PSWQ has been found to distinguish patients with generalised anxiety disorder (GAD) from other anxiety disorders. This questionnaire can be used in clinical and non-clinical settings.

Validity

The PSWQ has been validated in student (Meyer, Miller, Metzger, & Borkovec 1990) and clinical samples (Brown, Antony, & Barlow, 1992). This research has demonstrated that those with GAD have significantly higher PSWQ scores than people with other anxiety disorders, such as obsessive compulsive disorder (OCD). Scores on the PSWQ are positively correlated with other measures of pervasive worry (Gillis, Haaga, & Ford, 1995). The PWSQ also has high internal consistency and good test-retest reliability.

Interpretation

Scores range from 16 to 80 with higher scores indicative of higher levels of trait worry. A total raw score is given as output which is converted into three percentiles, comparing the total score to three different samples: An adult community sample (n = 244) showing the client’s score in relation to the normal population (Gillis, Haaga, & Ford, 1995). A social anxiety disorder percentile comparing the client’s score with those with social anxiety (n = 132) and a GAD percentile comparing scores to people diagnosed with generalised anxiety disorder (n = 28), (Turk, Fresco, Mennin & Heimberg (2001). Typically individuals with GAD will score highly on this measure compared to other anxiety disorders.

Developer

Meyer, T. J., Miller, M. L., Metzger, R. L., & Borkovec, T. D. (1990). Development and validation of the penn state worry questionnaire. Behavior Research and Therapy, 28, 487-495.

Spence Children’s Anxiety Scale – Parent (SCAS-Parent)

$
0
0
The scale is completed by a parent of an anxious child between the ages of 6 to 18. It provides an overall measure of anxiety together with scores on six sub-scales each tapping a specific aspect of child anxiety. – Panic attack and agoraphobia – Separation anxiety – Physical injury fears – Social phobia – Obsessive compulsive – Generalized anxiety disorder / overanxious disorder

Validity

The scales was normed and validated by Nauta, Scholing, Rapee, Abbott, Spence and Waters (2004) with 484 parents of anxiety disordered children and 261 parents in a normal control group. Results of confirmatory factor analysis provided support for six intercorrelated factors, that corresponded with the child self-report as well as with the classification of anxiety disorders by DSM-IV (namely separation anxiety, generalized anxiety, social phobia, panic/agoraphobia, obsessive–compulsive disorder, and fear of physical injuries). Compared to the child version of the same test, parent–child agreement ranged from 0.41 to 0.66 in the anxiety-disordered group, and from 0.23 to 0.60 in the control group. For comprehensive information visit the Spence Children’s Anxiety Scale website at: www.scaswebsite.com

Interpretation

Scores consist of a total raw score (between 0 and 114) and six subscale scores. Results are also converted to percentile ranks based on an Anxiety Disordered Children sample and a Normal Population Children sample, based on the child’s gender and age (Nauta et al.,novoPsych 2004). – Panic attack and agoraphobia (items 12,19,25,27,28,30,32,33,34) – Separation anxiety (items 5,8,11,14,15,38) – Physical injury fears (items 2,16,21,23,29) – Social phobia (items 6,7,9,10,26,31) – Obsessive compulsive (items 13,17,24,35,36,37) – Generalized anxiety disorder (items 1,3,4,18,20,22) Any scores more than the 84th percentile (1 standard deviation from the normal population mean) are considered to be clinically significant.

Developer

Nauta, Scholing, Rapee, Abbott, Spence and Waters. (2004). A parent report measure of children’s anxiety. Behaviour Research and Therapy. 42 (7), 813-839.

Frost Multidimensional Perfectionism Scale (FMPS)

$
0
0

This inventory consists of 35 questions measuring four sub-scales of perfectionism:
– Concern over mistakes and doubts about actions
– Excessive concern with parents’ expectations and evaluation
– Excessively high personal standards
– Concern with “precision, order and organization”
Setting excessively high standards is the most prominent feature of perfectionism, accompanied by tendencies for overly critical evaluations of one’s own behavior, expressed in over concern for mistakes and uncertainty regarding actions and beliefs.
Some individuals take pride in their perfectionistic nature and such beliefs can be a key target for psychological intervention. This scale can be useful in highlighting that being highly perfectionist is in fact unhelpful. This test is appropriate for people 15 years and older and is especially appropriate for individuals with critical parents, anorexia, OCD traits or an anxiety disorder. Perfectionistic beliefs may be an important underlying cause of a range of psychopathologies.

Validity

The Frost Multidimensional Perfectionism Scale was created by Dr. Randy Frost and colleagues in 1990 and originally measured six sub-scales. Subsequent evaluation using principal components analysis found that four sub-scales were more appropriate. Stober (1998) validated the scale using 243 university student participants with an average age of 26.3 years.
The validity of the scale has been widely established through convergence with other clinically significant problems, including anxiety in college students (Frost & Marten, 1990), insomnia (Lundh, Broman, Hetta, & Saboonchi, 1994), social phobia (Juster, Heimberg, Frost, Holt, Mattia, & Faccenda, 1996), obsessive-compulsive symptoms (Rheaume, Freeston, Dugas, Letarte, & Ladouceur, 1995) and anorexia nervosa (Bastiani, Rao, Weltzin, & Kaye, 1995). In fact, perfectionism may be the underlying trait in many of these problems.

Interpretation

Results consist of a Total Perfectionism score (total of subscales not including Organization) as well as four subscales, presented as raw scores and percentile ranks. The percentiles are based on the data from Stober’s (1998) sample of university students (mean age 26.3).
Higher percentiles indicate more problems while a percentile closer to 50 represents the average response. High scores on the Organization subscale do not contribute to Total Perfectionism and are not intrinsically problematic, but combined with high scores on the other factors may exacerbate dysfunction.
The four subscales are:
-Concern over Mistakes and Doubts about Actions
(Questions 9,10,13,14, 17,18,21,23,25,28,32,33,34)
– Parental Expectations and Criticism
(Questions 1,3,5,11,15,20,22,26,35)
– Personal Standards
(Questions 4,6,12,16,19,24,30)
– Organization
(Questions, 2,7,8,27,29,31)

Developer

NFrost, R. O., & Marten, P. A. (1990). Perfectionism and evaluative threat. Cognitive Therapy and Research, 14, 559-572.

Stober, J. (1998). The Frost Multidimensional Perfectionism Scale: More perfect with four (instead of six) dimensions. Personality and Individual Differences, 24(4), 481-491.

Dr Nathan Castle – Chief Science & Evaluation Officer​

$
0
0

Meet Dr Nathan Castle, our new Chief Science & Evaluation Officer

As the Chief Science and Evaluation Officer Dr Nathan Castle supports professionals and services to implement data-driven practices via NovoPsych’s comprehensive digital platform. Dr Castle is a Clinical Psychologist with expertise in Routine Outcome Measurement, Evaluation and Deliberate Practice. He has experience leading a data-driven Private Practice in East Geelong that evaluates client outcomes and provides feedback in real time.


How to create customised email templates

$
0
0

How to create customised email templates

Sometimes when you’re sending a client an assessment via email, you’ll want to modify the standard email text to better reflect how your practice works. Within NovoPsych you can save up to 5 email templates, using the below steps:

1. Go to Account
2. Select Account Details
3. Scroll down to find Email Templates
4. Click on Create Template

5. Fill in your Template Title, Email Subject and Message.

Note: # are available for name and word shortcuts. These shortcuts will be automatically populated when sending an email. 

6. Click Save

To use the template go to the home screen, click Email Assessment, Select Client, Select Assessment(s), then click Customise Email. You can then Insert Email Template from the drop-down to access previously saved templates.

Webinar: An Easy Way for Psychologists to be  Scientist-Practitioners in Private Practice

$
0
0

Remember those idealistic notions at uni about psychologists being scientist-practitioners? And then we get out into the real world and lose the “scientist” part? Yeah, us too.

This webinar aims to reinvigorate your understanding of how we can use psychometric assessments to improve patient outcomes.  
We will:
1) Consider why measuring client outcomes can help you and your clients
2) Define ways to enhance care by decreasing client drop-out and improve client engagement
3) Introduce an easy-to-use model for implementing outcome measures to collect practice-based evidence

Importantly, this training will focus on how to put these strategies in place in real-world settings. In this webinar the research is summarised and integrated into practical techniques delivered by two presenters with expertise in using outcome measures in their own private practices. 

Date: 17th May 2021
Time: 5:30pm to 6:45pm (Australian Eastern Standard Time: AEST)
How: Zoom
Cost: Free. Please RSVP here
Connect via Zoom: https://novopsych.com.au/join-webinar

How to delete scheduled assessments?

$
0
0

How to delete scheduled assessments?

NovoPsych allows you to setup a reoccurring email to clients so they can receive an assessment weekly, monthly and so on. A client can unsubscribe themselves if they don’t want to receive them (via a link in the automated email), or you can cancel the schedule yourself. 

If you want to cancel a recurring scheduled assessment that was made in error, or you do not need anymore:

1. Go to Clients
2. Select your Client
3. Under Scheduling, you will find all your ‘active’ schedules in progress
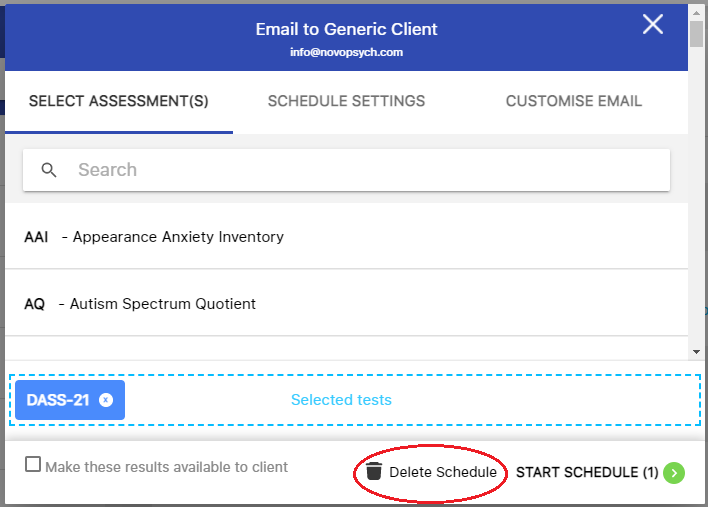
4. Click on the date

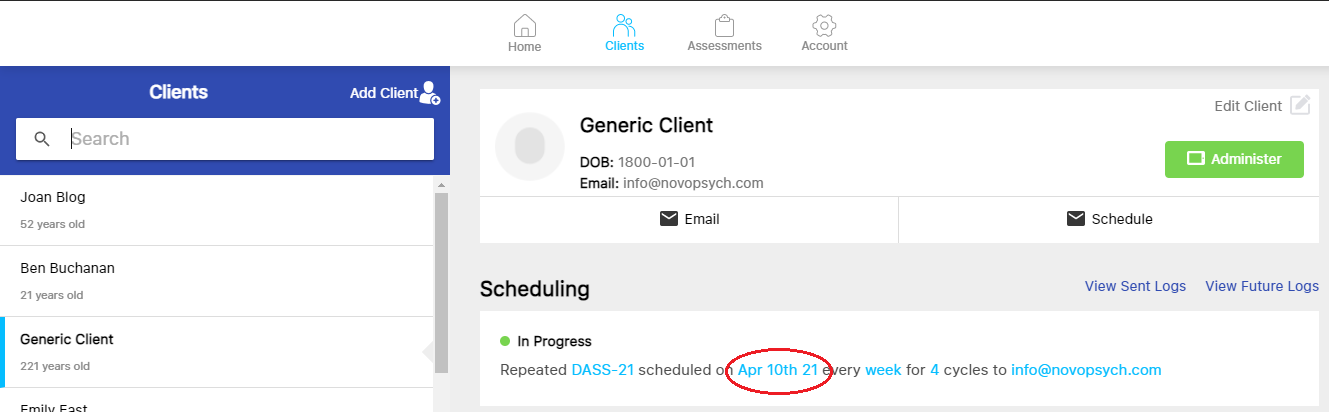
5. Click ‘delete schedule’

How to change or update my payment details?

Obsessional Compulsive Inventory – Child Self Report (ChOCI-R-S)

$
0
0

The Obsessional Compulsive Inventory-Revised-Self Report (ChOCI-R-S) is a 32-item self-report measure assessing the presence and severity of Obsessive Compulsive Disorder (OCD) in children and adolescents aged 7-17 years.

This measure is completed by a child. There is an alternative parent-report version that can be used in conjunction with this scale (ChOCI-R-P). The scales is useful in the diagnosis of childhood OCD and to characterise the nature of obsessions and compulsions. It can also be used to track symptoms over time.

The ChOCI-R is of similar format to the Child Yale-Brown Obsessive Compulsive Scale (CY-BOCS), as compulsions and obsessions are addressed separately, but is self-report rather than clinician rated.

When the scale is administered on two or more occasions scores are graphed over time. This can provide useful feedback in the context of treatment and information about which OCD symptom clusters have reduce or remained higher.

Validity and Reliability

Uher, Heyman, Turner and Shafran (2008) evaluated the test with a clinical sample of 285 children and adolescents with OCD. The ChOCI-R has acceptable internal consistency, and the ChOCI-R impairment scales show convergent validity with the similarly-structured CY-BOCS. The measure also demonstrates divergent validity with a measure of general child psychopathology. The self-report version of the ChOCI-R yielded clearer distinctions between obsessions and compulsions than the parent-report version.

Scoring and Interpretation

A raw score for each compulsion and obsession subscale is provided as output, along with raw scores for total impairment (range 0-48) and total symptoms (range 0-40).

Each subscale is computed as follows:

– Compulsion Symptom score: Sum of questions 1 to 10
– Compulsions Impairment score: Sum of questions 14 to 19

– Obsession Symptom score: Sum of questions 20 to 29
– Obsession Impairment score: Sum of questions 33 to 38

– Total symptom score: compulsion symptom score + obsession symptom score
– Total impairment score: compulsions severity score + obsession severity score

Higher total impairment scores indicate higher levels of severity/distress related to OCD symptoms, whilst higher total symptoms scores indicate greater complexity and pervasiveness of OCD symptoms.

Scores are also presented as percentiles based on responses for a sample of children referred to an OCD clinic (Uher et al., 2008). The percentiles are helpful for interpretation as they contextualises the respondents’ score in relation to patients with OCD. For example, a percentile of 50 is the average score for a child with OCD, and indicates typical (and clinically significant) symptoms.

Developer

Uher, R., Heyman, I., Turner, C. M., & Shafran, R. (2008). Self-, parent-report and interview measures of obsessive–compulsive disorder in children and adolescents. Journal of Anxiety Disorders, 22(6), 979-990. doi:10.1016/j.janxdis.2007.10.001

Reference

Uher, R., Heyman, I., Turner, C. M., & Shafran, R. (2008). Self-, parent-report and interview measures of obsessive–compulsive disorder in children and adolescents. Journal of Anxiety Disorders, 22(6), 979-990. doi:10.1016/j.janxdis.2007.10.001

Viewing all 308 articles
Browse latest View live