Quantcast
Channel: NovoPsych
Viewing all 314 articles
Browse latest View live

Mindfulness-Based Self Efficacy Scale – Revised (MSES-R)

$
0
0

The Mindfulness-based Self-Efficacy Scale – Revised (MSES-R) is a 22-item self-report scale for adults and adolescents (age 16+) designed to measure levels of self-efficacy in overcoming daily stressors. The MSES-R was developed with a focus on measuring skills that people felt improved in their lives as a consequence of mindfulness practice.

It was developed to measure the confidence in achieving the original purpose of mindfulness (reducing suffering), rather than measuring the construct of mindfulness itself. This is consistent with studies that have highlighted links between mindfulness and several forms of self-efficacy for improving self-regulation (Cayoun et al., 2022). 

Mindfulness based self-efficacy is assessed in six subscales:

  1. Emotion Regulation
  2. Social Skills
  3. Equanimity
  4. Distress Tolerance
  5. Taking Responsibility
  6. Interpersonal Effectiveness

The MSES-R is specifically designed as an outcome measure, where it assesses skills which typically develop from becoming more mindful while confronted by common stressors in daily life. When administered more than once the change in scores are graphed over time. A successful mindfulness based intervention is indicated by an increase in the total score.

The MSES-R is expected to be particularly helpful in a clinical context because a strong sense of self-efficacy (i.e., a person’s perception or belief in their ability to perform certain skills or act effectively to attain their goals; Bandura, 1997) is related to greater effort, persistence, and self-benefitting behaviours (Schwarzer, 2008).

Psychometric Properties

Confirmatory factor analysis was performed on the MSES-R scores collected online from two Australian samples (clinical N = 1378; community N = 2866), two Canadian samples (clinical N = 595; community N = 321), and one Australian university student sample (N = 521). The MSES-R provided adequate fit across all samples (Cayoun et al., 2022). The overall MSES-R measure was highly reliable (alpha = 0.89), as was the Emotion Regulation subscale (0.88). The reliability of the Social Skills subscale (0.72) was in the low to moderate range, with the reliability of the other subscales being low (0.47-0.65). Due to the low reliability of some subscales, it is recommended that users should rely on the total MSES-R score (Cayoun et al., 2022), but studies have also shown that subscale scores can be helpful in clinical settings (e.g., Francis, et al., 2022). The test-retest reliability of the MSES-R total score over two weeks was 0.88.

Higher overall scores on the MSES-R were significantly associated with higher scores on the Five Facet Mindfulness Questionnaire (FFMQ) overall (r = 0.62), as well as higher scores on many of its subscales (Cayoun et al., 2022). Higher scores on the MSES-R were also significantly associated with lower overall DASS scores (r =  − 0.68), and on each subscale: Depression (r =  − 0.60), Anxiety (r =  − 0.56), and Stress (r =  − 0.62; Cayoun et al., 2022).

In a validation study by Cayoun et al. (2022), 4638 adults from the general community (54% females and 46% males, mean age = 38.9) were assessed using the MSES-R. Although raw scores were provided by Cayoun et al. (2022), we have computed average scores (raw score divided by the number of questions) so that subscales can be compared. The below means and standard deviations are used to compute percentile ranks, with both the raw scores (Cayoun et al., 2022) and calculated average scores presented:

1. MSES-R Total Score: Raw Score: Mean 57.7 (SD 13.3); Average Score: Mean 2.6 (SD 0.6)
2. Emotion Regulation: Raw Score: Mean 14.8 (SD 5.4); Average Score: Mean 2.5 (SD 0.9)
3. Social Skills: Raw Score: Mean 7.97 (SD 2.6); Average Score: Mean 2.7 (SD 0.9)
4. Equanimity: Raw Score: Mean 9.96 (SD 3.1); Average Score: Mean 2.5 (SD 0.8)
5. Distress Tolerance: Raw Score: Mean 8.1 (SD 2.5); Average Score: Mean 2.7 (SD 0.8)
6. Taking Responsibility: Raw Score: Mean 7.95 (SD 2.5); Average Score: Mean 2.7 (SD 0.8)
7. Interpersonal Effectiveness: Raw Score: Mean 8.9 (SD 2.2); Average Score: Mean 3.0 (SD 0.7)

Scoring and Interpretation 

Scores are presented as Average Scores with a range between 0 and 4, where higher scores are indicative of higher self-efficacy with mindfulness skills.

A normative percentile is also calculated which compares the respondents score to a community sample. A percentile rank of 50 indicates an average level of self-efficacy with mindfulness skills in comparison to the normative comparison group. Interpretation using the percentile is useful because it contextualises responses in comparison to healthy peers.

There are 6 subscales for the MSES-R:

  1. Emotion Regulation (items 1, 4, 6, 7, 12, 18): relates to an involuntary or subconscious emotional response that is well modulated.

  2. Social Skills (items 2, 3, 20): social abilities in the broader sphere of interaction.

  3. Equanimity (items 5, 10, 13, 19): the ability to normalise difficulties and prevent reactivity.

  4. Distress Tolerance (items 8, 16, 17): inhibits avoidance of experiential intolerance or discomfort.

  5. Taking Responsibility (items 11, 21, 22): clarity of interpersonal boundaries and locus of control.

  6. Interpersonal Effectiveness (items 9, 14, 15): the ability to connect with others within the intimate sphere of relationships.

Developer

Cayoun, B., Elphinstone, B., Kasselis, N., Bilsborrow, G., & Skilbeck, C. (2022). Validation and Factor Structure of the Mindfulness-Based Self Efficacy Scale-Revised. Mindfulness, 13(3), 751–765. https://doi.org/10.1007/s12671-022-01834-6

References

Bandura, A. (1997). Self-efficacy: The exercise of control. Freeman.

Francis, S. E. B., Shawyer, F., Cayoun, B., Enticott, J., and Meadows, G. N. (2022). Group Mindfulness-integrated Cognitive Behavior Therapy (MiCBT) reduces depression and anxiety and improves flourishing in a transdiagnostic primary care sample compared to treatment-as-usual: a randomized controlled trial. Frontiers in Psychiatry, 13, 815170. https://doi.org/10.3389/fpsyt.2022.815170

Schwarzer, R. (2008). Modeling health behavior change: How to pre-dict and modify the adoption and maintenance of health behaviors. Applied Psychology, 57(1), 1–29. https:// doi. org/ 10. 1111/j. 1464- 0597. 2007. 00325.x


Organising Clients with Groups

$
0
0

Organising Clients with Groups

Allocating your clients to groups can help keep your clients organised. Groups are useful if you want some users (practitioners) to have access to some groups of clients or if you’re analysing outcome data on a group specific level. 

If you’re part of a practice with multiple users (practitioners) you can use groups to make clients (patients) who belong to that group visible to some users. This is an alternative method of controlling client access by individually assigning clients to particular users. 

Examples of when groups might be useful include if you’re wanting to analyse your outcome data on a group specific level. For example, if you want to compare treatment response for a group receiving CBT versus a group receiving psychopharmacotherapy, you could create two groups, and allocate clients to those groups. When data is downloaded and analysed the group for the client will be recorded. 

To use the group function, follow the instructions below.

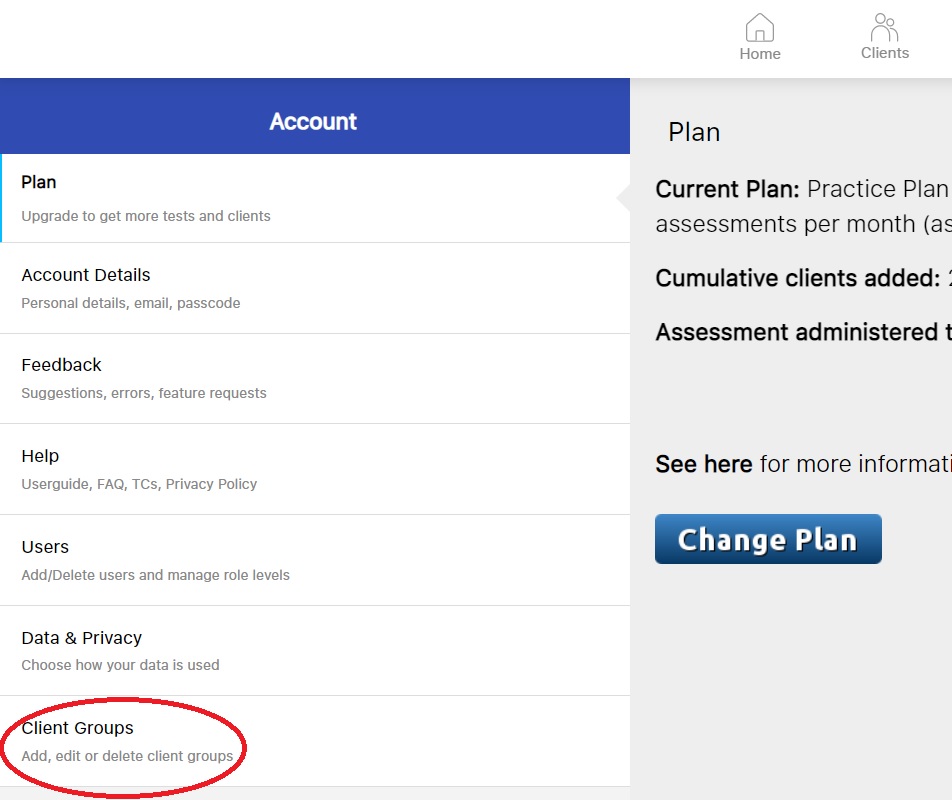
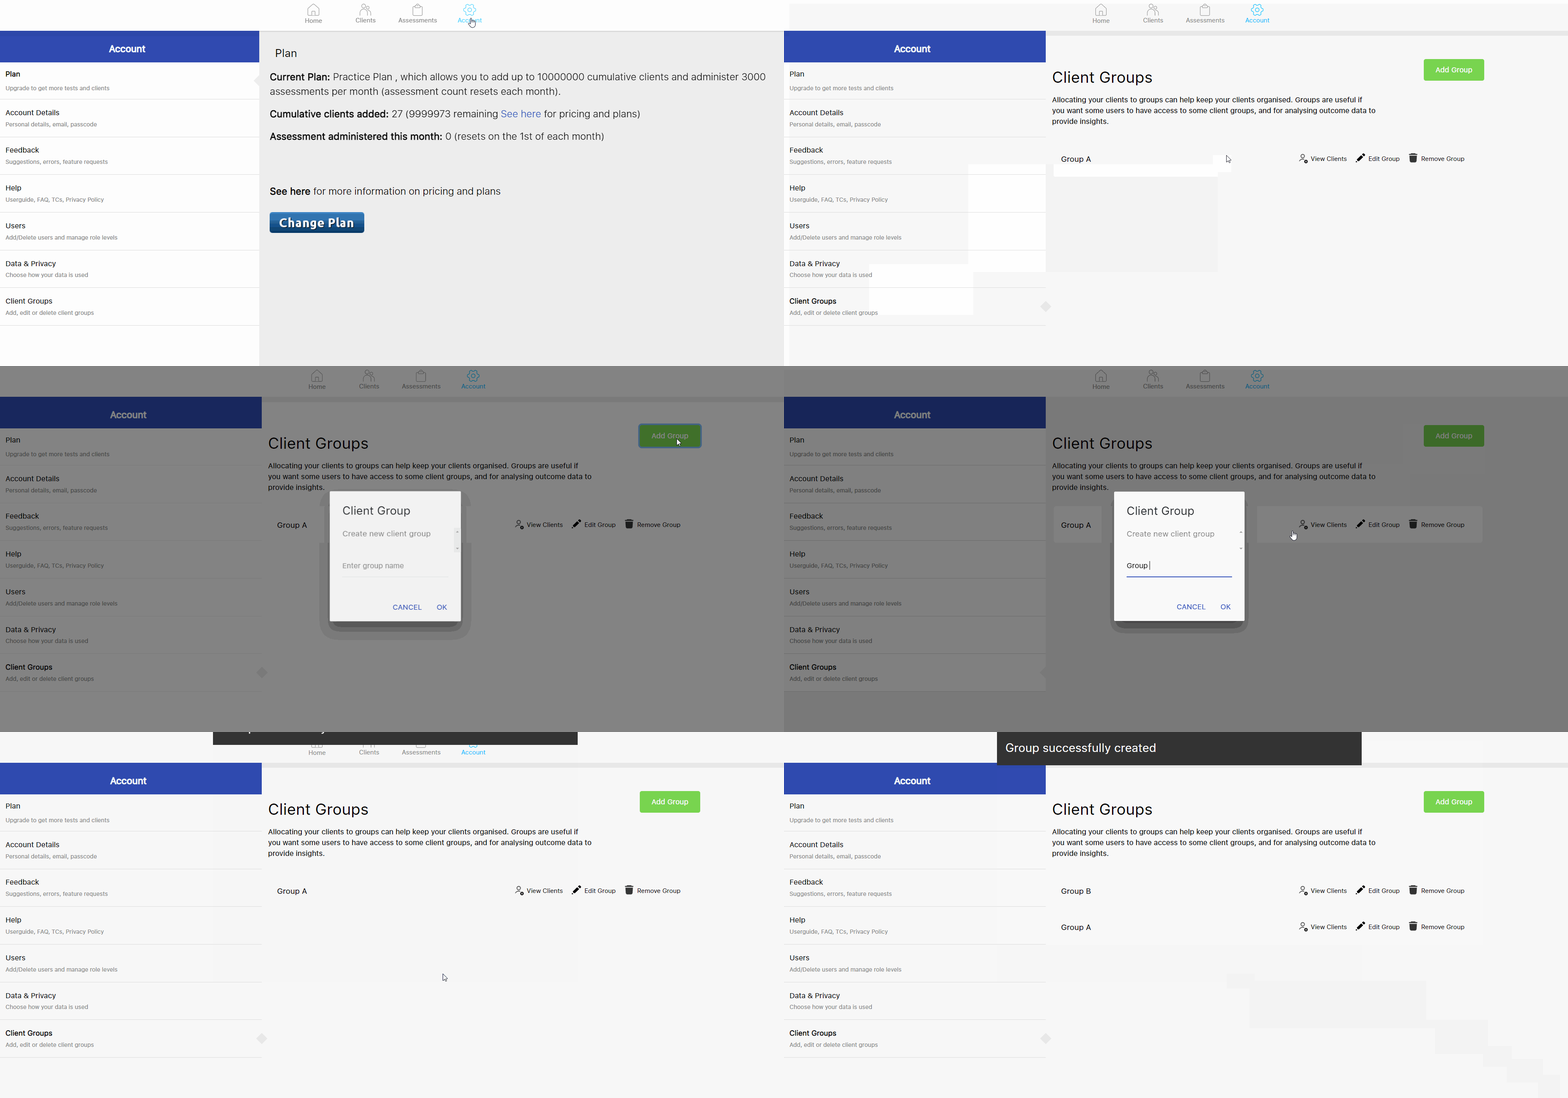
1. Go to the Account tab of your NovoPsych account.

2. Click on “Client Groups”.

3. To create a new group, click “Add Group”.

4. Type in the name of the Group you want to create.

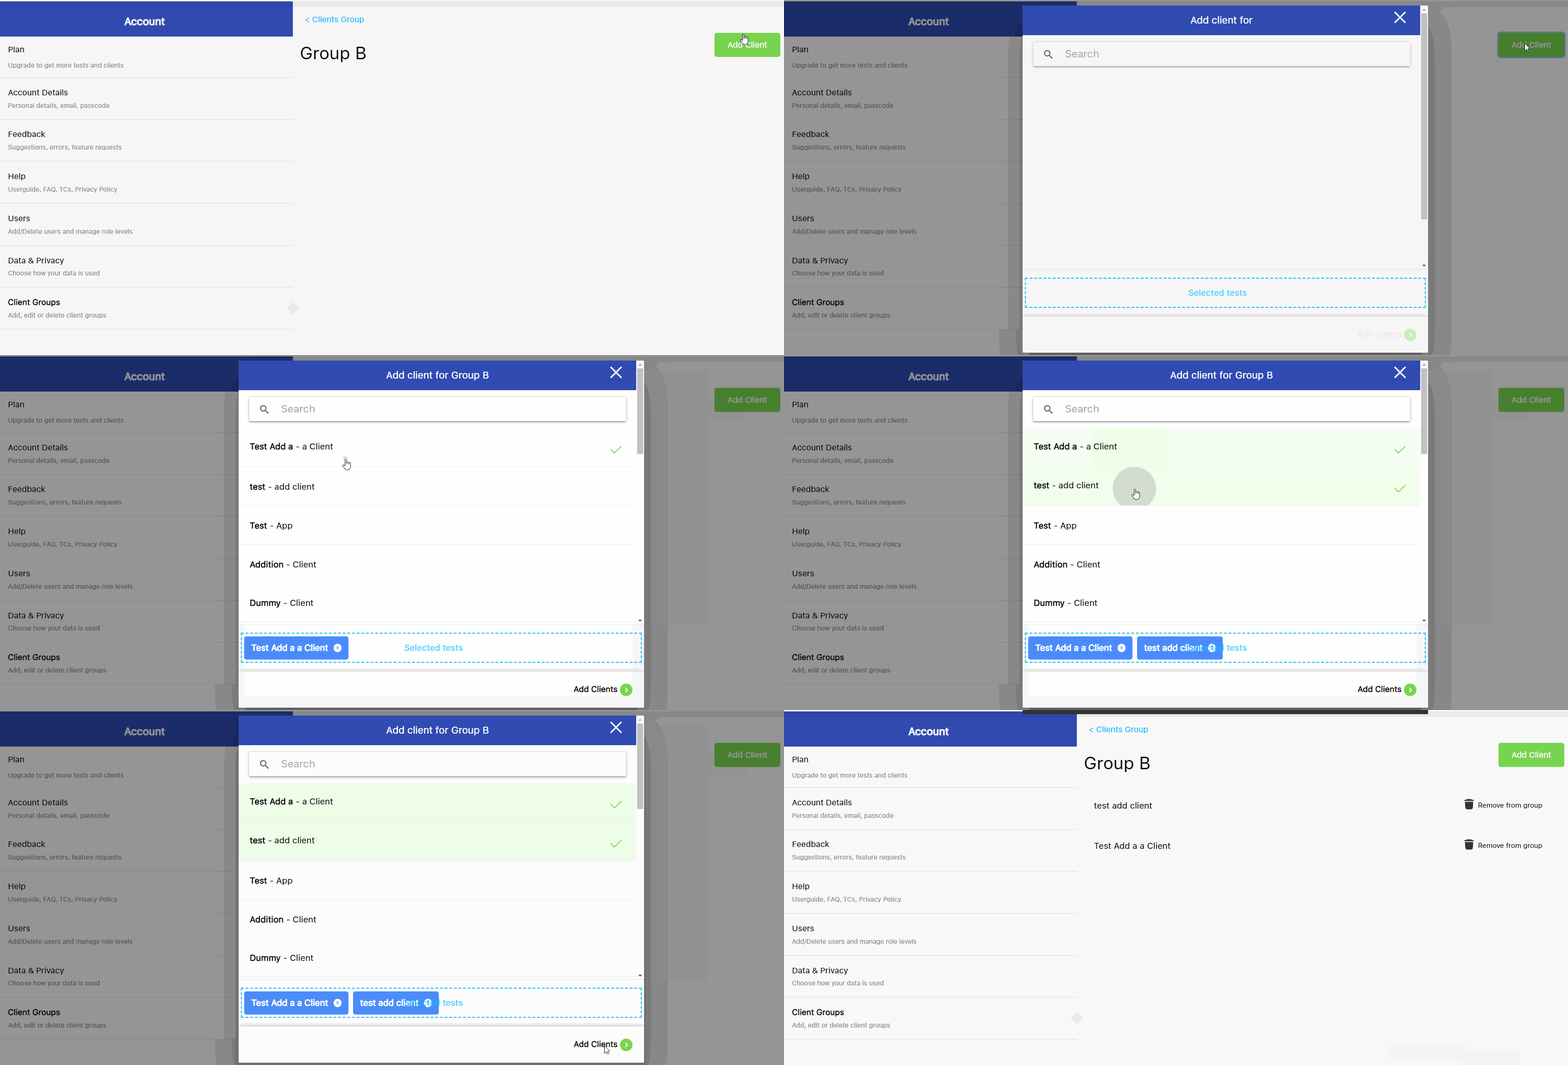
5. To add clients to a group, click on  the “View Clients” option of the group.

6. On the top right hand corner, there is a green button called “Add Client”. Click this button.

7. A list of all clients on the account will show. Select the clients you wish to have added to this group.

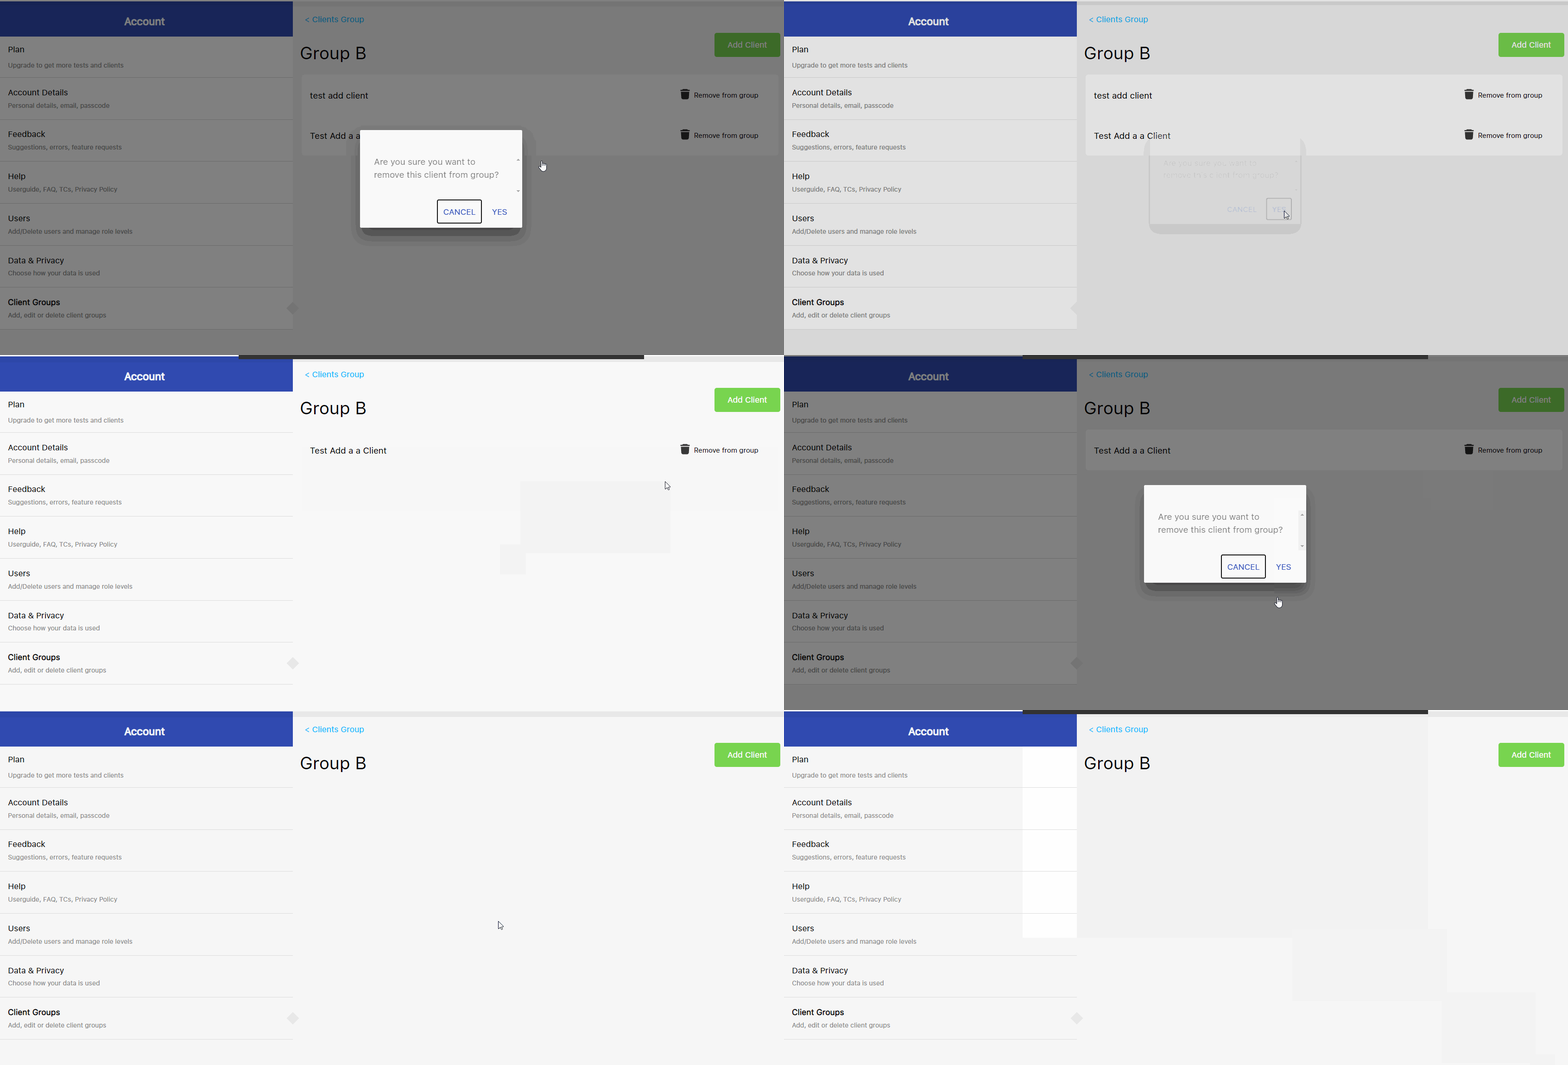
8. To remove a client from a group, click “View Clients”

9. Click “Remove from Group”. To confirm the removal, click yes

Add Client to a Group from the Clients Page

  1. To add a client to a group from the clients page, first go to the “Clients” tab.
  2. Locate the client you are wanting to add to a group
  3. Click “Edit Client”
  4. Select the Client Group Option.
  5. Select the Group you want the client to be allocated to

6. You can also check what Group a client is allocated to by selecting the client, and then clicking “Edit Client”.

Removing/Deleting a Group

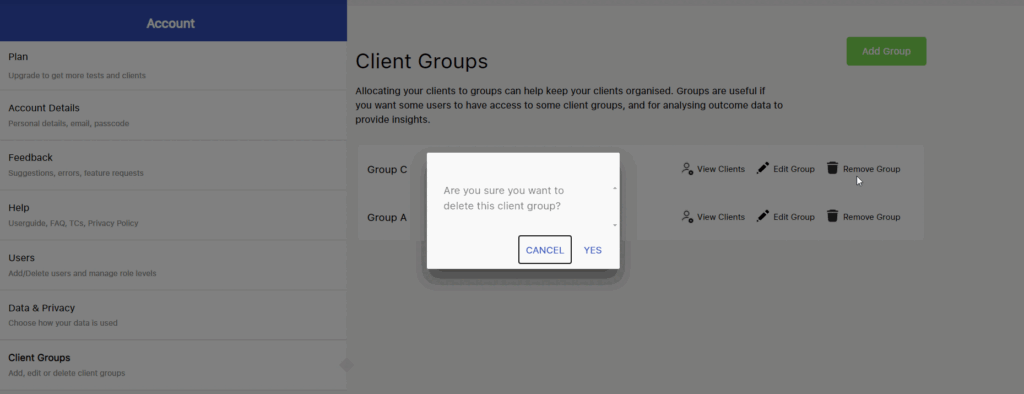
  1. Go to the Account tab
  2. Click on the “Client Groups” tab
  3. Locate the group you wish to remove
  4. Click “Remove Group” on the right side. Note this will not delete clients, but will remove their association with the group.

Allocate a User (practitioner) to a Group

If you’re part of a practice with multiple users (practitioners) you can use groups to make clients (patients) who belong to that group visible to some users. This is an alternative method of controlling client access to individually assigning clients to particular users. 

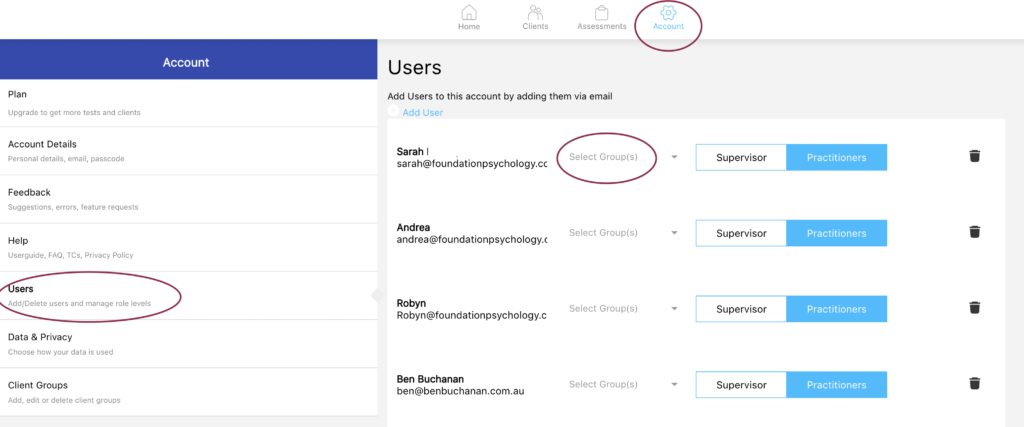
  1. Account tab
  2. Users
  3. Select Groups(s)

That user will then have access to all the clients included in that group. To remove their access to those clients, you can remove the user from the group following the same process.

Positive and Negative Affect Schedule (PANAS)

$
0
0

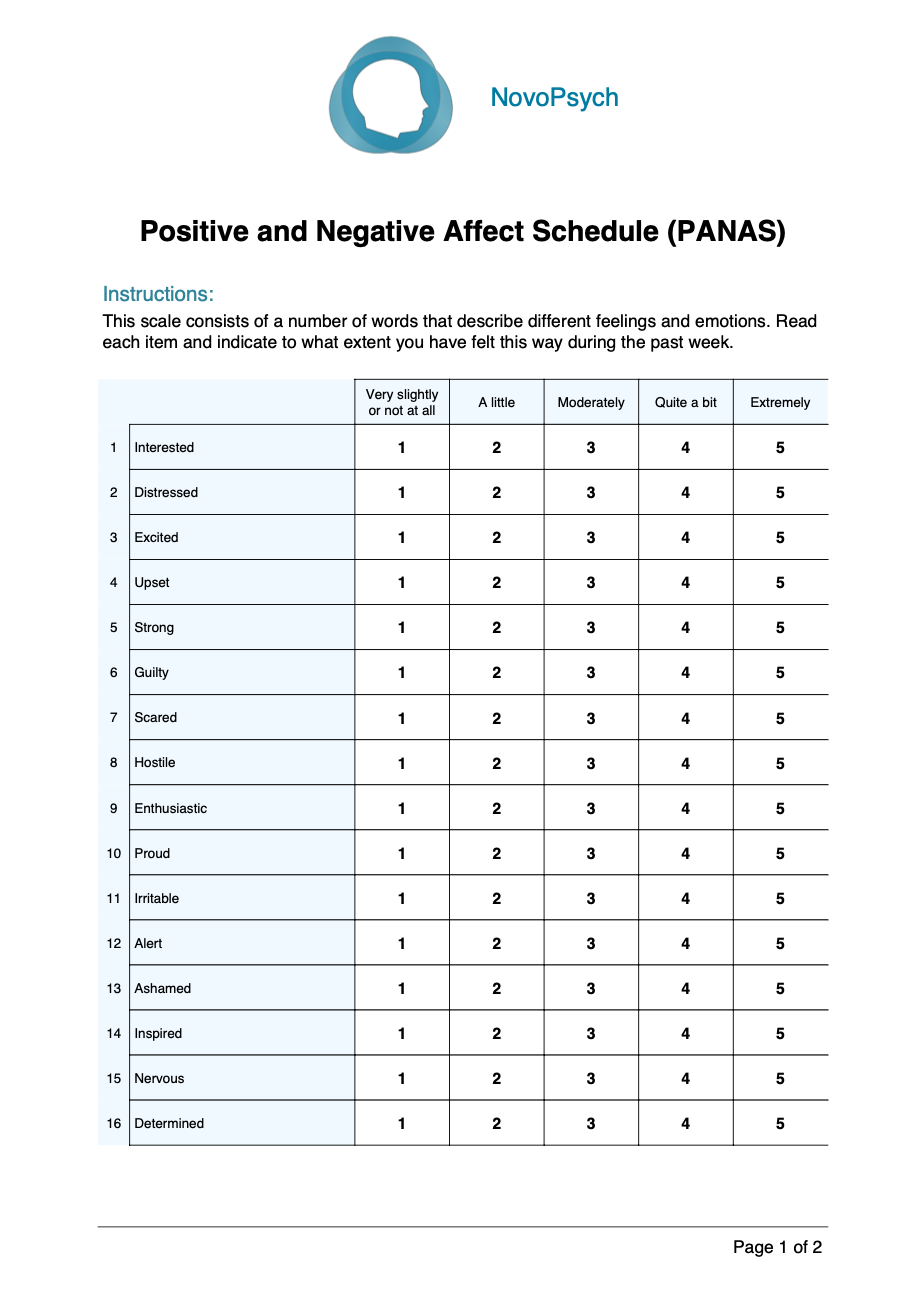
The Positive and Negative Affect Schedule (PANAS; Watson et al., 1988) is a 20-item self- report measure to assess positive affect (PA) and negative affect (NA). PA is associated with pleasurable engagement with the environment, whereas NA reflects a dimension of general distress summarising a variety of negative states such as anger, guilt, or anxiety. The PANAS is a useful tool for therapists who are interested in tracking changes in positive and negative emotions for clients from week to week as they engage in day-to-day life. The PANAS is sensitive to momentary changes in affect and can be used to chart the immediate effects of therapy sessions as well as outcomes associated with positive psychological interventions, exercises, or activities.

Psychometric Properties

The PANAS has been reported to have very good internal consistency reliability, with alphas ranging from 0.85 to 0.90 for Positive Affect and from 0.84 to 0.87 for Negative Affect (Crawford & Henry, 2004; Heubeck & Wilkinson, 2019). Test–retest reliability is good over an 8-week time period, with correlations of 0.54 for momentary Positive Affect, 0.45 for momentary Negative Affect.

Since the introduction of the PANAS, many studies examined its factorial validity using exploratory (EFA) or confirmatory factor analysis (CFA) and have come to different conclusions about which measurement model fits best (Wedderhoff et al., 2021). A meta- analysis from 47 independent studies using over 54,000 participants (Wedderhoff et al., 2021) found a correlated two-factor model including error correlations within content categories provided the best fit for all samples.

Based upon a large sample of non-clinical Australian adult (18 to 50 years old) respondents on both the state (n = 1059) version of the PANAS (Heubeck & Wilkinson, 2019), means and standard deviations were determined:

  • Positive Affect: 26.48 (8.1)
  • Negative Affect: 14.80 (5.49)

Scoring and Interpretation 

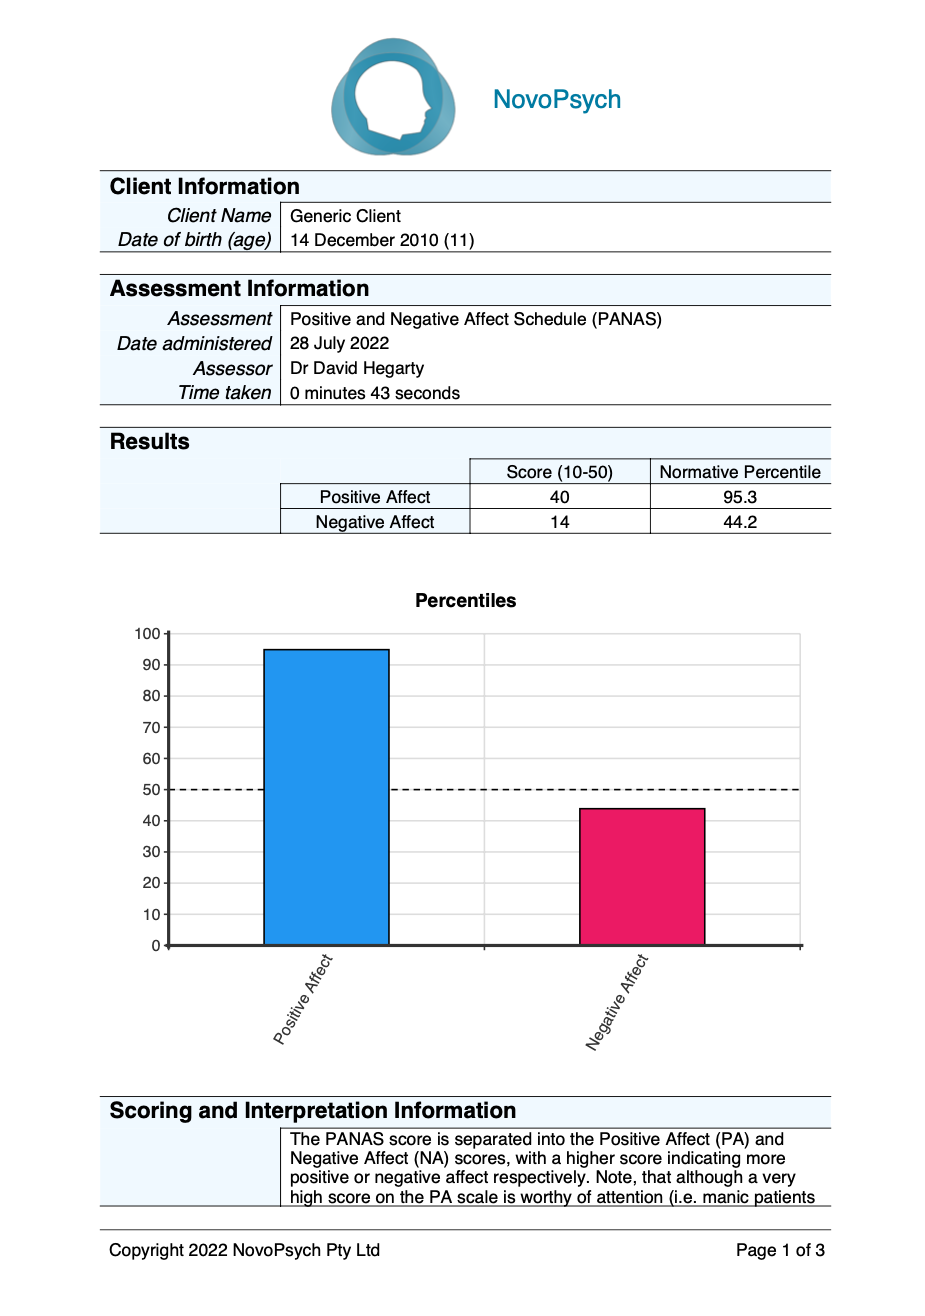
The PANAS score is separated into the Positive Affect (PA) and Negative Affect (NA) scores, with a higher score indicating more positive or negative affect respectively. Note, that although a very high score on the PA scale is worthy of attention (i.e. manic patients will typically score very highly on PA), the principal clinical concern will be with patients who show very low levels of positive affect (i.e. are anhedonic) and thus obtain low percentile ranks. In contrast, a high score on the NA (and a high percentile) is an indicator of psychological distress.

Normative data was collected from over 1,000 Australian adults and is used to calculate percentiles. A percentile rank of 50 indicates an average level of positive or negative affectivity in comparison to the normative group.

There are two subscales of the PANAS:

  1. Positive Affect (items 1, 3, 5, 9, 10, 12, 14, 16, 17, and 19). Higher scores represent higher levels of PA and are associated with pleasurable engagement with the environment.
  2. Negative Affect Sore (items 2, 4, 6, 7, 8, 11, 13, 15, 18, and 20). Higher scores represent higher levels of NA and reflect a dimension of general distress summarising a variety of negative states such as anger, guilt, or anxiety.

Developer

Watson, D., Clark, L. A., & Tellegen, A. (1988). Development and validation of brief measures of positive and negative affect: The PANAS scales. Journal of Personality and Social Psychology, 54(6), 1063–1070. https://doi.org/10.1037/0022-3514.54.6.1063

References

Crawford, J. R., & Henry, J. D. (2004). The positive and negative affect schedule (PANAS): construct validity, measurement properties and normative data in a large non-clinical sample. The British Journal of Clinical Psychology / the British Psychological Society, 43(Pt 3), 245–265. https://doi.org/10.1348/0144665031752934

Heubeck, B. G., & Wilkinson, R. (2019). Is all fit that glitters gold? Comparisons of two, three and bi-factor models for Watson, Clark & Tellegen’s 20-item state and trait PANAS. Personality and Individual Differences, 144, 132–140. https://doi.org/10.1016/j.paid.2019.03.002

Vanderbilt ADHD Diagnostic Teacher Rating Scale (VADTRS)

$
0
0

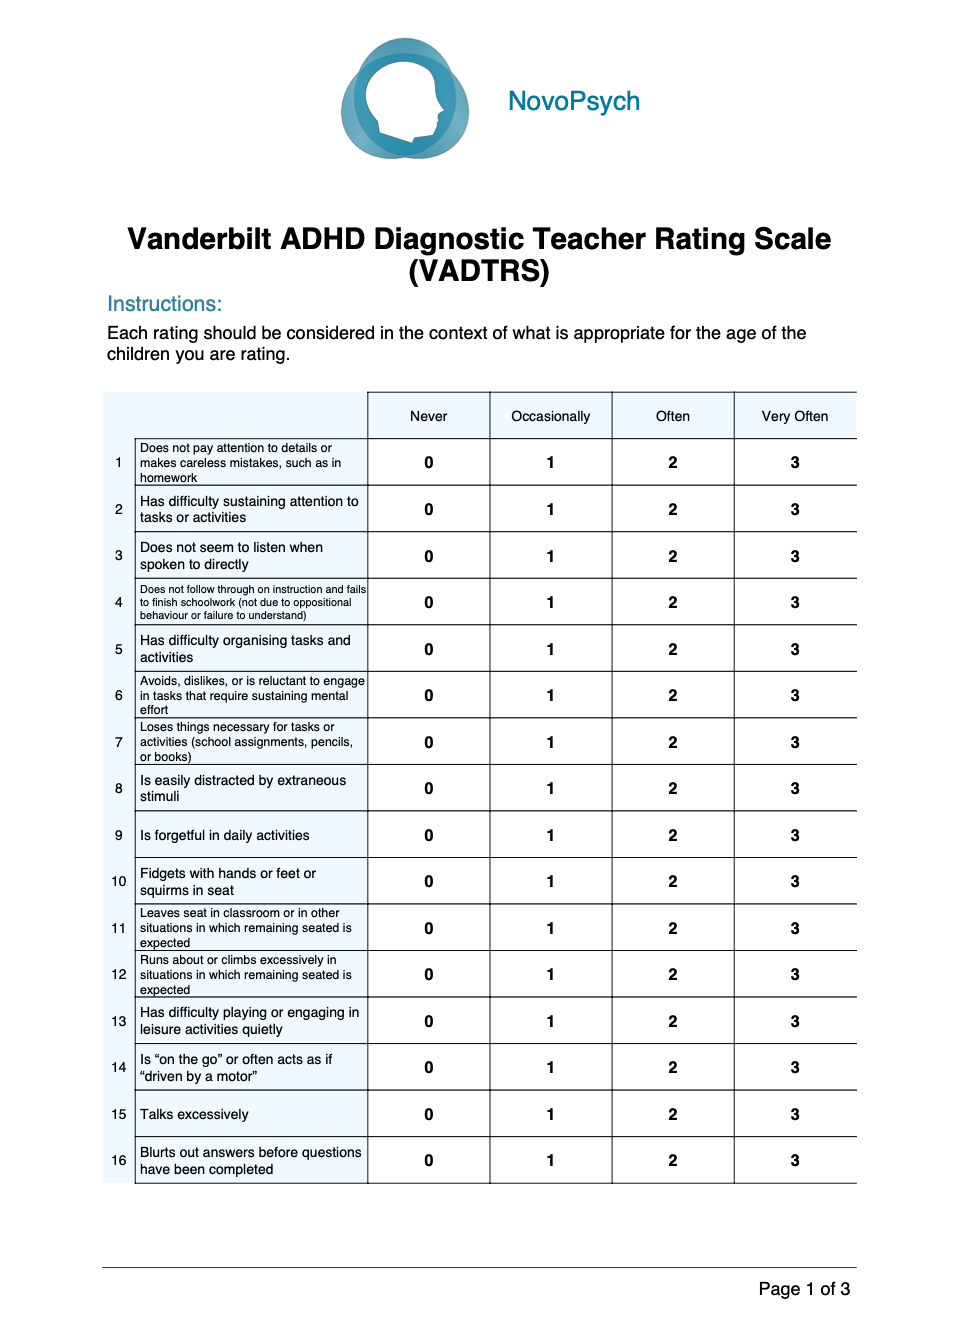
The Vanderbilt ADHD Diagnostic Teacher Rating Scale (VADTRS) is used to help in the diagnostic process of Attention Deficit/Hyperactivity Disorder (ADHD) in children between the ages of 6 and 12. It is the teacher rated version which can be used in parallel with the parent version: Vanderbilt ADHD Diagnostic Parent Rating Scale (VADPRS).

It has a total of 35 questions, includes all 18 of the DSM criteria for ADHD and is to be completed by a current teacher of the child. As well as identifying inattentive, hyperactive/impulsive, or combined subtypes of ADHD, it can also be used to identify symptoms of frequent comorbidities, including oppositional defiance, anxiety and depression. 

Psychometric Properties

The VADTRS demonstrates good construct validity, with a 4-factor model (inattention, hyperactivity, conduct/oppositional, and anxiety/depression problems) fitting the data well, and good convergent validity, with the SDQ was high (Pearson’s correlations > .72) for all 4 factors (Wolraich et al., 2013). For predictive validity, the VADTRS produced a sensitivity of .69, specificity of .84, positive predictive value of .32, and negative predictive value of .96 when predicting future case definitions among children whose parents completed a diagnostic interview (Wolraich et al., 2013).  

Scoring and Interpretation 

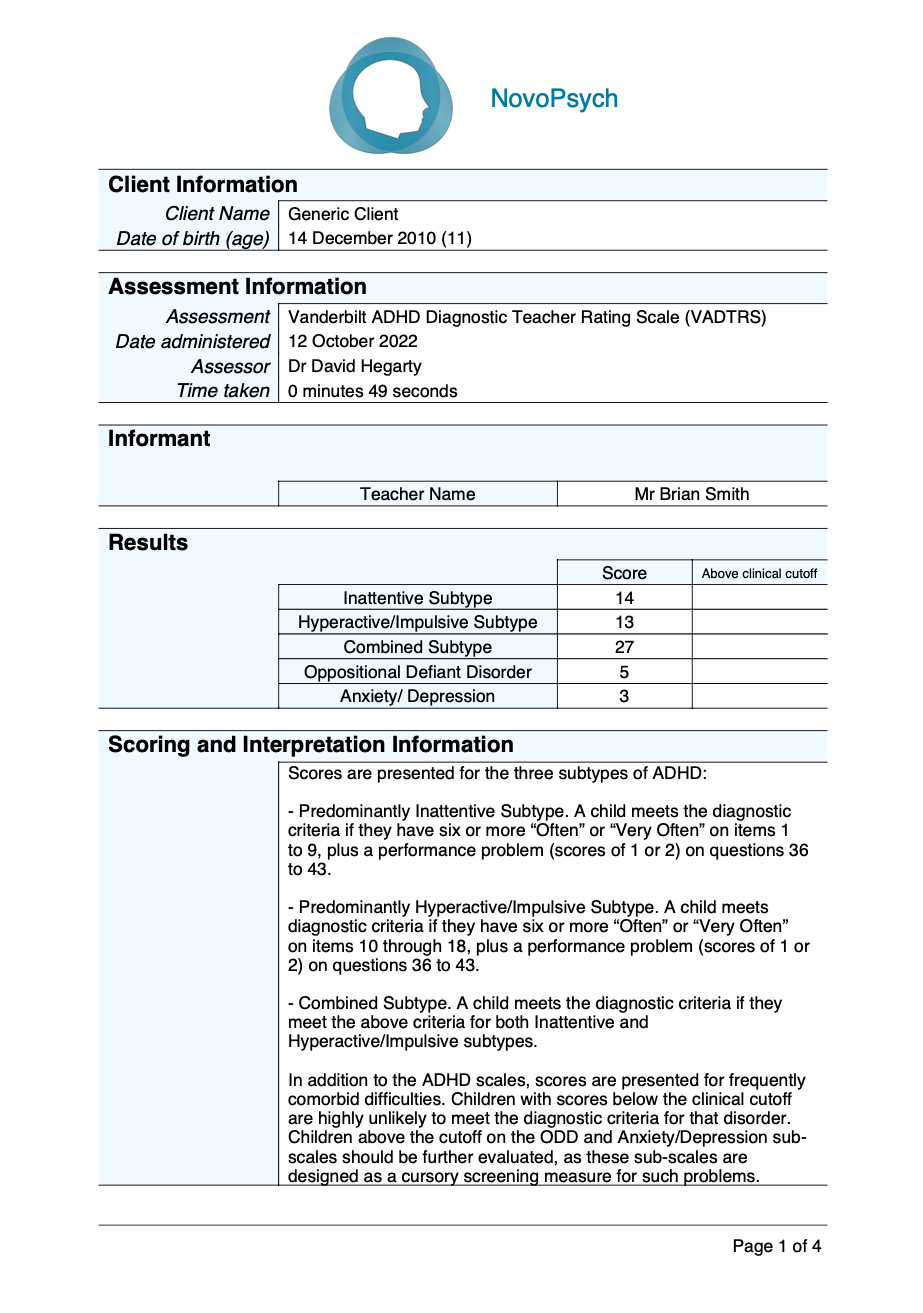
Scores are presented for the three subtypes of ADHD:

  • Predominantly Inattentive Subtype. A child meets the diagnostic criteria if they have six or more “Often” or “Very Often” on items 1 to 9, plus a performance problem (scores of 1 or 2) on questions 36 to 43.
  • Predominantly Hyperactive/Impulsive Subtype. A child meets diagnostic criteria if they have six or more “Often” or “Very Often” on items 10 through 18, plus a performance problem (scores of 1 or 2) on questions 36 to 43.
  • Combined Subtype. A child meets the diagnostic criteria if they meet the above criteria for both Inattentive and Hyperactive/Impulsive subtypes.

In addition to the ADHD scales, scores are presented for frequently comorbid difficulties. Children with scores below the clinical cutoff are highly unlikely to meet the diagnostic criteria for that disorder. Children above the cutoff on the ODD and Anxiety/Depression sub-scales should be further evaluated, as these sub-scales are designed as a cursory screening measure for such problems.

  • Oppositional Defiant Disorder (items 19 to 28). To be above the clinical cutoff score of 2 or 3 on 3 (or more) out of 10 behaviours on questions 19–28 AND score a 1 or 2 on any of the performance questions 36–43.
  • Anxiety/ Depression (items 29 to 35). To be above the clinical cutoff scores a 2 or 3 on 3 (or more) out of 7 behaviours on questions 29–35 AND score a 1 or 2 on any of the performance questions 36–43.  

Developer

Wolraich, M. L., Bard, D. E., Neas, B., Doffing, M., & Beck, L. (2013). The psychometric properties of the Vanderbilt attention-deficit hyperactivity disorder diagnostic teacher rating scale in a community population. Journal of developmental and behavioral pediatrics : JDBP, 34(2), 83–93. https://doi.org/10.1097/DBP.0b013e31827d55c3  


McLean Screening Instrument for BPD (MSI-BPD)

$
0
0

The MSI-BPD is a 10-item self-report instrument used to screen for borderline personality disorder (BPD; Zanarini et al., 2003) in youth (15 years of age or greater; Chanen et al., 2008; Noblin et al., 2013; van Alebeek et al., 2017) or adults.

Screening for BPD is an important consideration given it is a significant public health problem that is under recognised and underdiagnosed in clinical practice (Zimmerman & Balling, 2021) and for patients diagnosed with BPD, the lag between initial treatment seeking and the correct diagnosis is often more than 10 years (Magnavita et al., 2010). As BPD is associated with high rates of self-harm, suicide attempts, and death by suicide in adults and adolescents, screening and assessment of BPD is an important clinical intervention (Boylan et al., 2019).

The MSI-BPD is based on a subset of the questions that comprise the borderline module of the Diagnostic Interview for DSM-IV Personality Disorders or DIPD-IV (Zanarini, et al., 2003) and is a well-validated and widely-used screener for BPD (Zimmerman & Balling, 2021). The ten items of the MSI-BPD are written such that a positive response indicates the presence of BPD symptoms.

Each item of this instrument is rated on a dichotomous scale with 1 corresponding to “present” and 0 corresponding to “absent” and all items are written such that a positive responses indicate the presence of BPD symptoms.

Psychometric Properties

The MSI-BPD has illustrated satisfactory reliability and validity (Zanarini et al., 2003) with a Cronbach alpha of 0.78. Gardner and Qualter (2009) found that the MSI-BPD correlated highly with other BPD screening tools in a mixed community and student sample, and reported that confirmatory factor analysis suggested that the MSI-BPD is an appropriate measure for assessing BPD as a global construct.

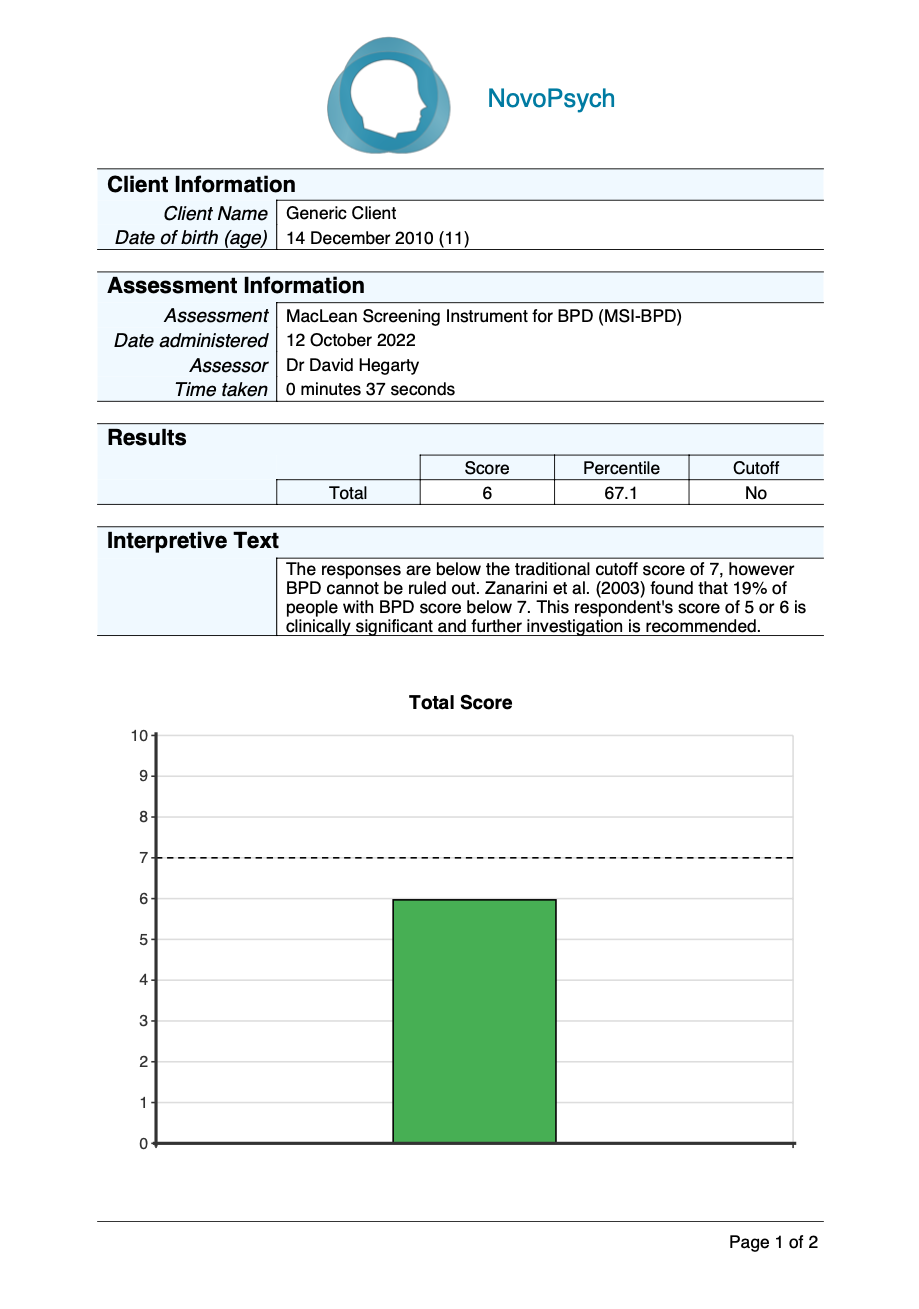
The past empirical evidence has suggested the score of greater than or equal to 7 as a useful clinical cutoff score in screening for BPD among adults (Zanarini et al., 2003) with a sensitivity of 81% and specificity of 89%. However, a review of the literature by Zimmerman & Balling (2021) for over 1,473 subjects determined that a 90% sensitivity (higher sensitivity is important for a screening test) requires a cutoff score slightly lower than 7. Although there was no definitive recommendation for what that score should be, they found that various studies required a cutoff score of 5 or 6 to reach the 90% sensitivity level (Zimmerman & Balling, 2021). Noblin et al. (2013) also found that a lower cutoff (5.5 or greater) might be beneficial for use with adolescents.

A sample of 235 US university students (55% female: mean age = 18.5) provided normative data for the MSI-BPD, with a mean score of 4.83 and standard deviation of 2.64 (Klonsky & Glenn, 2009).

Scoring and Interpretation 

The total score ranges from 0 to 10, with a score greater than or equal to 7 being above the cutoff for Borderline Personality Disorder (Zanarini et al., 2003). If the client scores 5 or 6, then further evaluation for BPD is recommended (Zimmerman & Balling, 2021). Scores of 4 or less indicates the level of symptoms are not consistent with BPD.

A percentile is also presented, which compares the respondent’s scores to a normative sample of university students. A percentile rank close to 50 indicates that the individual’s score is typical compared to the normative sample. A percentile of 75, for example, indicates that the respondent scored higher than 75% of people in the normative sample.

Developer

Zanarini, M. C., Vujanovic, A. A., Parachini, E. A., Boulanger, J. L., Frankenburg, F. R., & Hennen, J. (2003). A screening measure for BPD: the McLean Screening Instrument for Borderline Personality Disorder (MSI-BPD). Journal of Personality Disorders, 17(6), 568–573. https://doi.org/10.1521/pedi.17.6.568.25355

References

Boylan, K., Chahal, J., Courtney, D. B., Sharp, C., & Bennett, K. (2019). An evaluation of clinical practice guidelines for self-harm in adolescents: The role of borderline personality pathology. Personality Disorders, 10(6), 500–510. https://doi.org/10.1037/per0000349

Chanen, A. M., Jovev, M. J., Djaja, D., McDougall, E., Yuen, H. P., Rawlings, D., & Jackson, H. J. (2008). Screening for borderline personality disorder in outpatient youth. Journal of Personality Disorders, 22(4), 353–364. https://guilfordjournals.com/doi/abs/10.1521/pedi.2008.22.4.353 

Gardner, K., & Qualter, P. (2009). Reliability and validity of three screening measures of borderline personality disorder in a nonclinical population. Personality and Individual Differences, 46, 636-641. https://doi.org/10.1016/j.paid.2009.01.005

Klonsky, E. D., & Glenn, C. R. (2009). Assessing the functions of non-suicidal self-injury: Psychometric properties of the Inventory of Statements About Self-injury (ISAS). Journal of Psychopathology and Behavioral Assessment, 31(3), 215–219. https://doi.org/10.1007/s10862-008-9107-z

Magnavita, J. J., Critchfield, K. L., Levy, K. N., & Lebow, J. L. (2010). Ethical considerations in treatment of personality dysfunction: Using evidence, principles, and clinical judgement. Professional Psychology: Research and Practice, 41, 64–74.

Noblin, J. L., Venta, A., & Sharp, C. (2014). The validity of the MSI-BPD among inpatient adolescents. Assessment, 21(2), 210–217. https://doi.org/10.1177/1073191112473177

van Alebeek, A., van der Heijden, P. T., Hessels, C., Thong, M.S.Y., & van Aken, M. (2017). Comparison of three questionnaires to screen for borderline personality disorder in adoles- cents and young adults. European Journal of Psychological Assessment, 33, 123–128.

Zimmerman, M., & Balling, C. (2021). Screening for Borderline Personality Disorder with the McLean Screening Instrument: A Review and Critique of the Literature. Journal of Personality Disorders, 35(2), 288–298. https://doi.org/10.1521/pedi_2019_33_451

Multidimensional Inventory of Dissociation – 60-item version (MID-60)

$
0
0

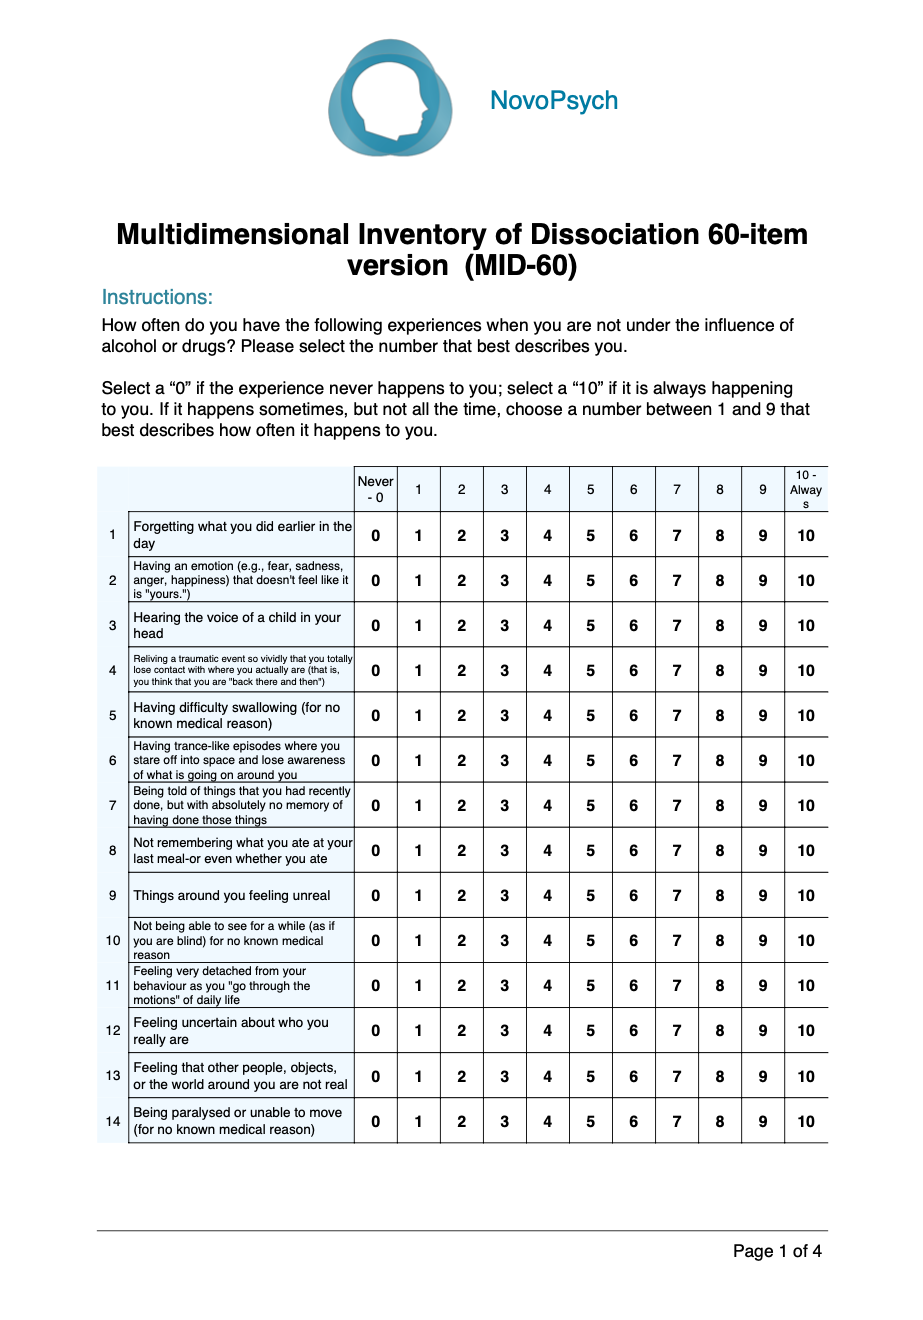
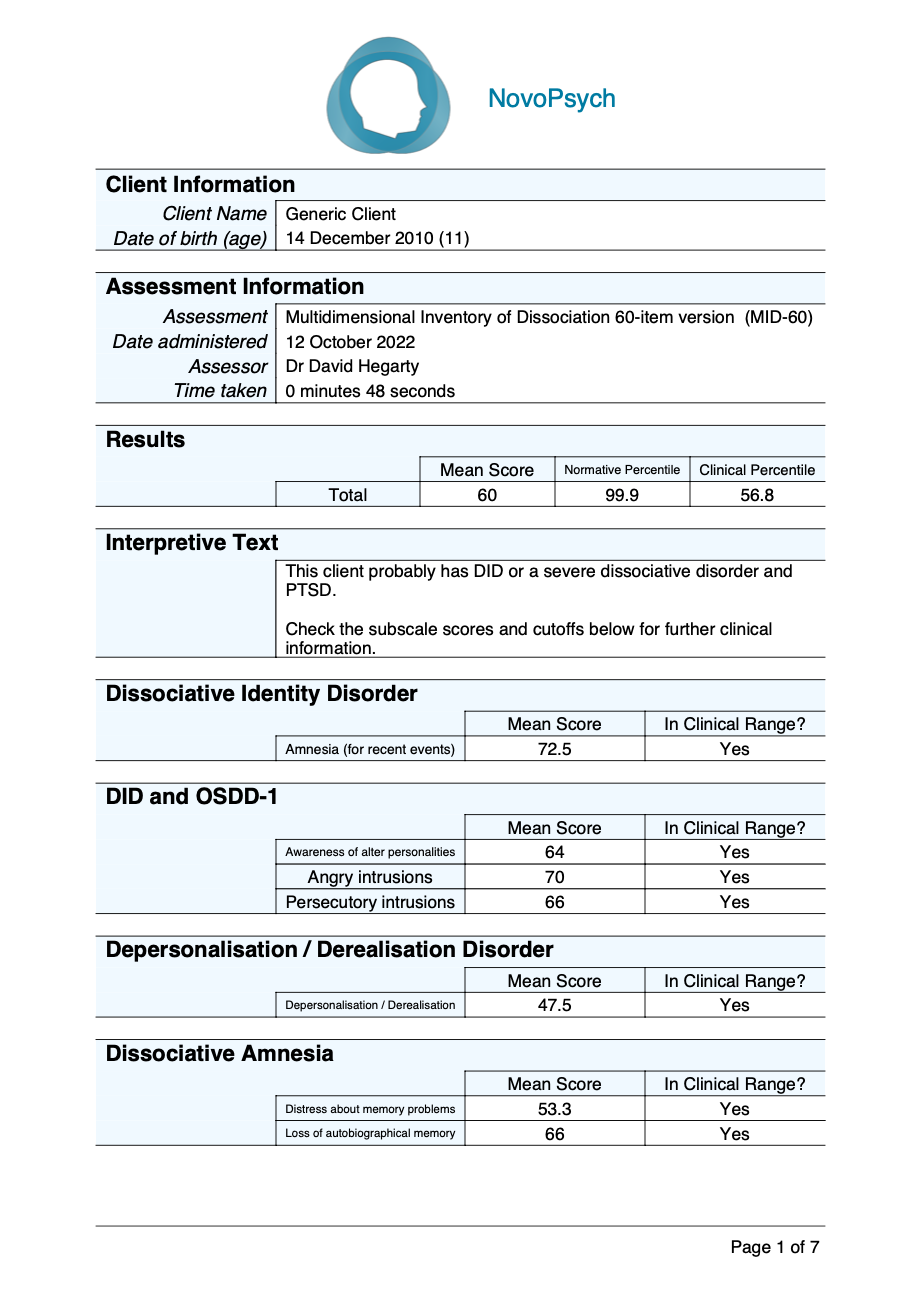
The Multidimensional Inventory of Dissociation 60-item version (MID-60) is a screening tool for adults (18 years +) that assesses dissociative symptoms and experiences specific to DSM-5-TR dissociative disorders. It also captures dissociative experiences, PTSD and somatic symptoms, and phenomena closely related to dissociation such as trance and self-confusion.

Dissociation is an adaptive defence in response to high stress or trauma that is characterised by memory loss, depersonalisation, derealisation, identity confusion, and identity alteration. Around 10% of the population will meet criteria for a dissociative disorder during their lifetime (Kate, Hopwood, Jamieson, 2020).

The MID-60 has 12 subscales, which are presented here according to the diagnostic category the subscale is most aligned to:

  • Dissociative identity disorder
    • 1. Amnesia (for recent events)
  • Dissociative identity disorder (DID) and its subclinical variant, other specified dissociative disorder – 1 (OSDD-1).
    • 2. Subjective awareness of alter personalities and self-states
    • 3. Angry intrusions
    • 4. Persecutory intrusions
  • Depersonalisation/derealisation disorder
    • 5. Derealisation/Depersonalisation
  • Dissociative amnesia
    • 6. Distress about severe memory problems
    • 7. Loss of autobiographical memory
  • Posttraumatic stress disorder
    • 8. Flashbacks
  • Conversion disorder
    • 9. Body symptoms
    • 10. Psychogenic non-epileptic seizures
  • General subscales
    • 11. Trance
    • 12. Self-confusion

Clients who are completing the MID-60 at home may benefit from further instructions available here.

Psychometric Properties

The MID-60 is a short version of the 218-item Multidimensional Inventory of Dissociation, a diagnostic instrument (Dell, 2006). The MID-60 was derived from the five items with the highest pattern matrix loading for each of the MID’s 12 factors (Dell & Lawson, 2009). The MID-60 has a nearly identical factor structure to the full MID, excellent internal reliability (α = .97) and content and convergent validity (Kate et al., 2020).

Normative sample
The mean score for both males and females in an Australian university sample (n = 313) was 13.0 (SD = 13.8; Kate et al., 2021). Age did not moderate mean scores MID-60. However, younger participants aged 24 or under had significantly higher scores on the subscales of self-confusion (19.3 vs. 14.6) and angry intrusions (10.0 vs. 6.6).

Clinical samples
Females with a dissociative disorder diagnoses (N = 30) had a mean MID-60 score of 56.8 (SD = 18.8) and the two males had a mean score of 53.4 (SD = 4.7; Kate, Jamieson & Middleton, 2021; 2022). This is consistent with the mean for the 218-item MID, i.e., DID (N = 76, M = 51.3, SD = 18.7) and OSDD-1 (N = 40, M = 39, SD 19.4; Dell et al., 2017). The MID mean has been calculated in people with schizophrenia experiencing a relapse (N = 20, M = 27.0, SD = 20.6) and in remission (N = 20, M = 18.4, SD = 19.2; Laddis & Dell, 2012) and in a clinical group with a borderline personality disorder diagnosis (N = 21, M = 25.4, SD = 18.1, Korzekwa et al., 2009).

Scoring and Interpretation 

Scores for each item range from zero (never) to 10 (always). The MID-60 mean score represents the percentage of time the person self-reports having dissociative symptoms and experiences. Hence, a person with dissociative identity disorder may have dissociative symptoms and experiences around half the time (51%) whereas for a university student this may be 13% of the time. A mean score of more than 21% indicates clinically significant symptoms.

Interpretation of MID-60 mean scores is consistent with the 218-item MID. Specifically:

  • 0–7: Does not have dissociative experiences
  • 7–14: Has few diagnostically significant dissociative experiences
  • 15–20: Mild dissociative symptoms and experiences. PTSD or a mild dissociative disorder (such as dissociative amnesia, depersonalisation / derealisation disorder) are possible
  • 21–30: May have dissociative disorder and/or PTSD
  • 31–40: May have a dissociative disorder (such as OSDD-1 or DID) and PTSD
  • 41–64: Probably has DID or a severe dissociative disorder and PTSD
  • 64 +: Severe dissociative and post-traumatic symptoms. High scores may also reflect neuroticism, attention seeking behaviour, exaggeration or malingering of symptoms, or psychosis

Subscales
The MID-60 provides information on subscales relevant to different diagnoses. This enables the clinician to form an impression about the likely diagnosis. For example, a score of 27% is clinically significant, but does not indicate the most likely diagnosis. If the subscales of PTSD and depersonalisation/derealisation are both above the clinical threshold, this can indicate the person has the dissociative subtype of PTSD, whereas if the memory-related subscales are above the clinical threshold this can indicate dissociative amnesia. Another example is a person who scores 45%, which would seem to indicate dissociative identity disorder. Yet, if the subscale score for amnesia (for recent events) is not elevated, this points towards a more severe case of other specified dissociative disorder. The subscales are:

  • DID: Amnesia (for recent events) – items 42, 45, 48, 58. Clinical cutoff = 10
  • DID / OSDD-1: Subjective awareness of alter personalities and self-states – items 3, 36, 39, 49, 57. Clinical cutoff = 20
  • DID / OSDD-1: Angry intrusions – items 28, 33, 35, 46, 60. Clinical cutoff = 18
  • DID / OSDD-1: Persecutory intrusions – items 22, 37, 44, 56, 59. Clinical cutoff = 18
  • Derealisation/Depersonalisation – items 2, 7, 9, 13, 25, 47, 50, 53. Clinical cutoff = 20
  • Dissociative Amnesia: Distress about severe memory problems – items 1, 8, 20, 38, 43, 52. Clinical cutoff = 30
  • Dissociative Amnesia: Loss of autobiographical memory – items 16, 19, 24, 29, 34. Clinical cutoff = 34
  • PTSD: Flashbacks – items 4, 15, 31, 40, 54. Clinical cutoff = 16
  • Conversion Disorder: Body symptoms – items 5, 10, 14, 18. Clinical cutoff = 10
  • Conversion Disorder: Pseudo-Seizures (Psychogenic non-epileptic seizures) – item 26. Clinical cutoff = 10
  • General Subscales: Trance – items 21, 27, 30, 32, 41, 51. Clinical cutoff = 11.7
  • General Subscales: Self-confusion – items 6, 11, 12, 17, 23, 55. Clinical cutoff = 33.3

The MID-60 is for screening purposes, is not designed to be the sole determinant of a diagnosis and should always be used in conjunction with clinical expertise. Further evaluations can be conducted with the Structured Clinical Interview for DSM-5 Dissociative Disorders (SCID-D) or Dissociative Disorders Interview Schedule (DDIS).

Developer

Kate, M.-A., Jamieson, G., Dorahy, M. J., & Middleton, W. (2021). Measuring Dissociative Symptoms and Experiences in an Australian College Sample Using a Short Version of the Multidimensional Inventory of Dissociation. Journal of Trauma & Dissociation, 22(3), 265-287. https://doi.org/10.1080/15299732.2020.1792024

References

Dell, P. F. (2006). The Multidimensional Inventory of Dissociation (MID): A Comprehensive measure of pathological dissociation. Journal of Trauma & Dissociation, 7(2), 77-106.

Dell, P. F., Coy, D. M., & Madere, J. (2017). An Interpretive Manual for the Multidimensional Inventory of Dissociation (MID). In (2nd ed.). https://www.mid-assessment.com/request-mid-analysis/

Kate, M.-A., Jamieson, G., & Middleton, W. (2021). Childhood Sexual, Emotional, and Physical Abuse as Predictors of Dissociation in Adulthood. Journal of Child Sexual Abuse, 1-24. https://doi.org/10.1080/10538712.2021.1955789

Kate, M.-A., Jamieson, G., & Middleton, W. (2022). Parent-child dynamics as predictors of dissociation in adulthood. [Manuscript submitted for publication]. Psychological Sciences, Southern Cross University.

Kate, M.-A., Jamieson, G., Dorahy, M. J., & Middleton, W. (2021). Measuring Dissociative Symptoms and Experiences in an Australian College Sample Using a Short Version of the Multidimensional Inventory of Dissociation. Journal of Trauma & Dissociation, 22(3), 265-287. https://doi.org/10.1080/15299732.2020.1792024

Kate, M.-A., Hopwood, T., & Jamieson, G. (2020). The prevalence of Dissociative Disorders and dissociative experiences in college populations: a meta-analysis of 98 studies. Journal of Trauma & Dissociation, 21(1), 16-61. https://doi.org/10.1080/15299732.2019.1647915

Korzekwa, M. I., Dell, P. F., Links, P. S., Thabane, L., & Fougere, P. (2009). Dissociation in Borderline Personality Disorder: A Detailed Look. Journal of Trauma & Dissociation, 10(3), 346-367. https://doi.org/10.1080/15299730902956838

Laddis, A., & Dell, P. F. (2012). Dissociation and Psychosis in Dissociative Identity Disorder and Schizophrenia. Journal of Trauma & Dissociation, 13(4), 397-413. https://doi.org/10.1080/15299732.2012.664967

Self-Compassion Webinar

$
0
0

Dr Stan Steindl Webinar: Compassion Focussed Therapy.

Compassion Motivation and Action in Clinical Practice

Date and time: 7th November, 7:30pm AEDT (see timezone)

Format: 1.5 hour interactive webinar on Zoom. 

Presenter: Dr Stan Steindl

Learning Objectives:

  • Learn to identify when compassion is an important target for therapy
  • Identify the benefits of compassion for psychological health
  • Understand keys for effective compassion focussed therapy interventions
  • Be able to use the Compassion Motivation and Action Scales to monitor progress in treatment
Sign up below

Webinar Summary

Compassion has become an important target in therapy. Cultivating compassionate action in one’s life, whether that be towards others or oneself, has been shown to have positive outcomes on psychological health and wellbeing.

A number of therapeutic approaches now have incorporated self-compassion, and compassion focused therapy (CFT) is an approach that is specifically designed to develop the compassionate mind in order to cope with life’s difficulties.

In this presentation, Dr Stan Steindl will give a brief overview of compassion and self-compassion in the psychological therapies, with a specific focus on CFT, as well as an overview of the importance and utility of ongoing monitoring of compassionate action and change across time using the Compassion Motivation and Action Scales (CMAS) alongside other measures routine outcome monitoring.

Dr Stan Steindl


Dr Stan Steindl is a Clinical Psychologist in private practice at Psychology Consultants Pty Ltd, and an Adjunct Associate Professor at School of Psychology, University of Queensland, Brisbane, Australia. He is co-director of the UQ Compassionate Mind Research Group.

He has over 20 years experience as a therapist, supervisor and trainer, and works with clients from a compassion focused therapy perspective.

His PhD examined combat-related post traumatic stress disorder and comorbid alcohol dependency, and he continues to work in the areas of trauma and addiction, as well as having a general clinical practice. His research interests are in the areas of motivation, compassion and compassion-based interventions, and especially the role of cultivating compassion and self-compassion in the context of trauma, shame, self-criticism and clinical disorders, as well as promoting psychological wellbeing.

Dt Stan Steindl is the co-author of the Compassion Motivation and Action Scales:

Webinar: Dissociation and dissociative disorders

$
0
0

Webinar:
Understanding and Identifying Dissociation and Dissociative Disorders
Dr Mary-Anne Kate

Date and time: 28th November, 7:30pm AEDT (see timezone)

Format: 1.5 hour interactive webinar on Zoom. 

Presenter: Dr Mary-Anne Kate

Learning Objectives:

  • Describe dissociative symptoms and experiences
  • Recognize who is at risk of a dissociative disorder
  • Identify the symptom profile for DSM-5-TR dissociative disorders
  • Use the Multidimensional Inventory of Dissociation – 60 item version (MID-60) to screen for a dissociative disorder, assess the extent and type of dissociation, and to monitor progress in treatment
Sign up below (it’s free!)

Webinar Summary

Dissociation is a defense mechanism that enables a person to cope with overwhelming or traumatic experiences. It is one of the most common mental health diagnoses with one in ten people meeting the criteria for a dissociative disorder during their lifetime.  It is also one of the most misunderstood and overlooked mental health presentations. Many individuals with a dissociative disorder have experienced complex trauma during childhood and the majority have comorbidities. These include depression, anxiety, PTSD, OCD, bipolar, eating disorders, borderline personality disorder, psychosis, and somatic, sleep, and substance use disorders. The comorbid disorders are most often the focus of treatment, yet the individual is unlikely to make significant progress unless the underlying dissociation is identified and addressed.

In this webinar, Dr Mary-Anne Kate will explore dissociation and the dissociative disorders in adults and adolescents, including the prevalence, causes, and diagnostic features. She will introduce participants to the Multidimensional Inventory of Dissociation – 60 item version (MID-60) for adults and the adolescent version (MID-60-A).  Mary-Anne will then guide participants through a series of case studies, including dissociative identity disorder, other specified dissociative disorder, dissociative amnesia, depersonalization disorder, and PTSD – dissociative subtype, to demonstrate the scoring and interpretation of the MID-60.

Dr Mary-Anne Kate

Dr Mary-Anne Kate is a psychology lecturer and researcher specialising in interpersonal trauma, attachment, and post-traumatic disorders. Mary-Anne currently lectures on the Master of Professional Psychology and Bachelor of Psychological Science programs at Southern Cross University and has previously taught on the Master of Mental Health. She developed the master’s unit on psychological assessment and psychopathology. She is a Scientific Committee member of the International Society for the Study of Trauma and Dissociation (ISSTD), where she also teaches the introductory course on dissociation. 

Mary-Anne developed the Multidimensional Inventory of Dissociation – 60 item version (MID-60) to screen for dissociative symptoms, DSM-5 dissociative disorders and PTSD. The MID-60 is the screening tool recommended by Eye Movement Desensitization and Reprocessing (EMDR) trainers throughout Europe, North America, and Australia, as well as Harvard Medical School. 

Contact

Contact: dissociationresearcher@gmail.com

Publications and MID-60 resources are available via Researchgate: https://www.researchgate.net/profile/Mary-Anne-Kate


International Trauma Questionnaire – Child and Adolescent Version (ITQ-CA)

$
0
0

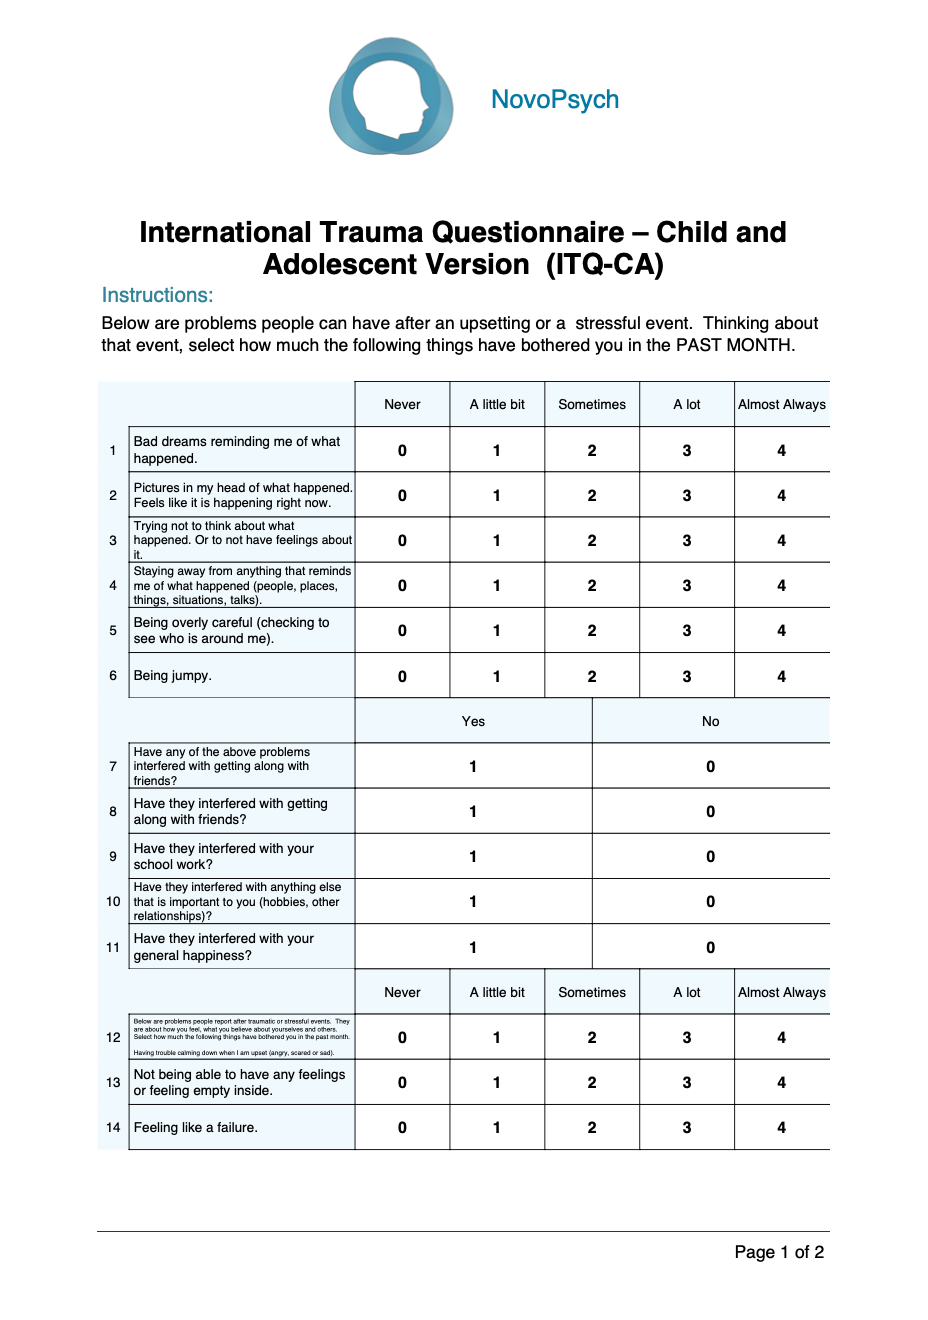
The International Trauma Questionnaire – Children and Adolescent Version (ITQ-CA) is a 22 item self-report measure focusing on the core features of Post Traumatic Stress Disorder (PTSD) and Complex PTSD (CPTSD) in children and adolescents (7 – 17 years old). It was developed to be consistent with the organising principles of the ICD-11 and is the child/adolescent version of the International Trauma Questionnaire (for adults; ITQ). The ITQ-CA is designed for diagnosis and can discriminate PTSD from CPTSD by employing validated diagnostic rules. The scale has two major subscales with three symptom clusters in each:

— PTSD —

  • Re-experiencing
  • Avoidance
  • Sense of threat

— Disturbances in self-organisation (DSO) —

  • Affective dysreglation
  • Negative self-concept
  • Disturbances in relationships

Disturbances in self-organisation is important in the assessment and diagnosis of CPTSD. The ITQ-CA is useful in the assessment of children and adolescents who have experienced trauma and asks them to answer the questions in relation to a specific traumatic event.

Psychometric Properties

The ITQ-CA was validated on 136 children in foster care and was found to conform to the same factor structure as the ITQ (Haselgruber et al., 2020a). Examining concurrent validity, moderate to strong bivariate correlations were found between all ITQ-CA scales and PTSD symptom clusters as assessed by the CATS (Haselgruber et al., 2020b). Larger than any other correlation among variables, the strongest correlations were found between ITQ-CA factors and respective CATS subscales: re-experiencing and intrusions (r = 0.73), avoidance from both measures (r = 0.74), threat and hyperarousal (r = 0.84), affective dysregulation and negative alterations (r = 0.84), negative self-concept and negative alterations (r = 0.78), and disturbances in relationships and negative alterations (r = 0.71). For convergent validity, PTSD and DSO correlated moderately to strongly with depression, anxiety and dissociation, whereas PTSD correlated most strongly with dissociation (r = 0.59) and DSO with anxiety (r = 0.63). Lifetime traumatisation correlated moderately with PTSD (r = 0.43) and DSO (r = 0.47).

Scoring and Interpretation 

There are two components of scoring and interpretation: Categorical scoring for the diagnosis of PTSD and CPTSD, and a dimensional component which measures symptom severity. The diagnosis of PTSD is indicated based on the following criteria:

  • Question 1 or 2 = one or more (re-experiencing)
  • Question 3 or 4 = one or more (avoidance)
  • Question 5 or 6 = one or more (sense of current threat)
  • Question 7, 8, 9, 10, or 11 = one or more (PTSD functional impairment)

PTSD is indicated if the criteria for PTSD are met and CPTSD is NOT met.

The diagnosis of Complex PTSD (CPTSD) is indicated based on the following criteria:

  • Question 12 or 13 = one or more (affective dysregulation)
  • Question 14 or 15 = one or more (negative self-concept)
  • Question 16 or 17 = one or more (disturbances in relationships)
  • Question 18, 19, 20, 21, or 22 = one or more (Disturbances in self-organisation impairment)

CPTSD is diagnosed if the criteria for PTSD are met AND criteria for CPTSD are met.

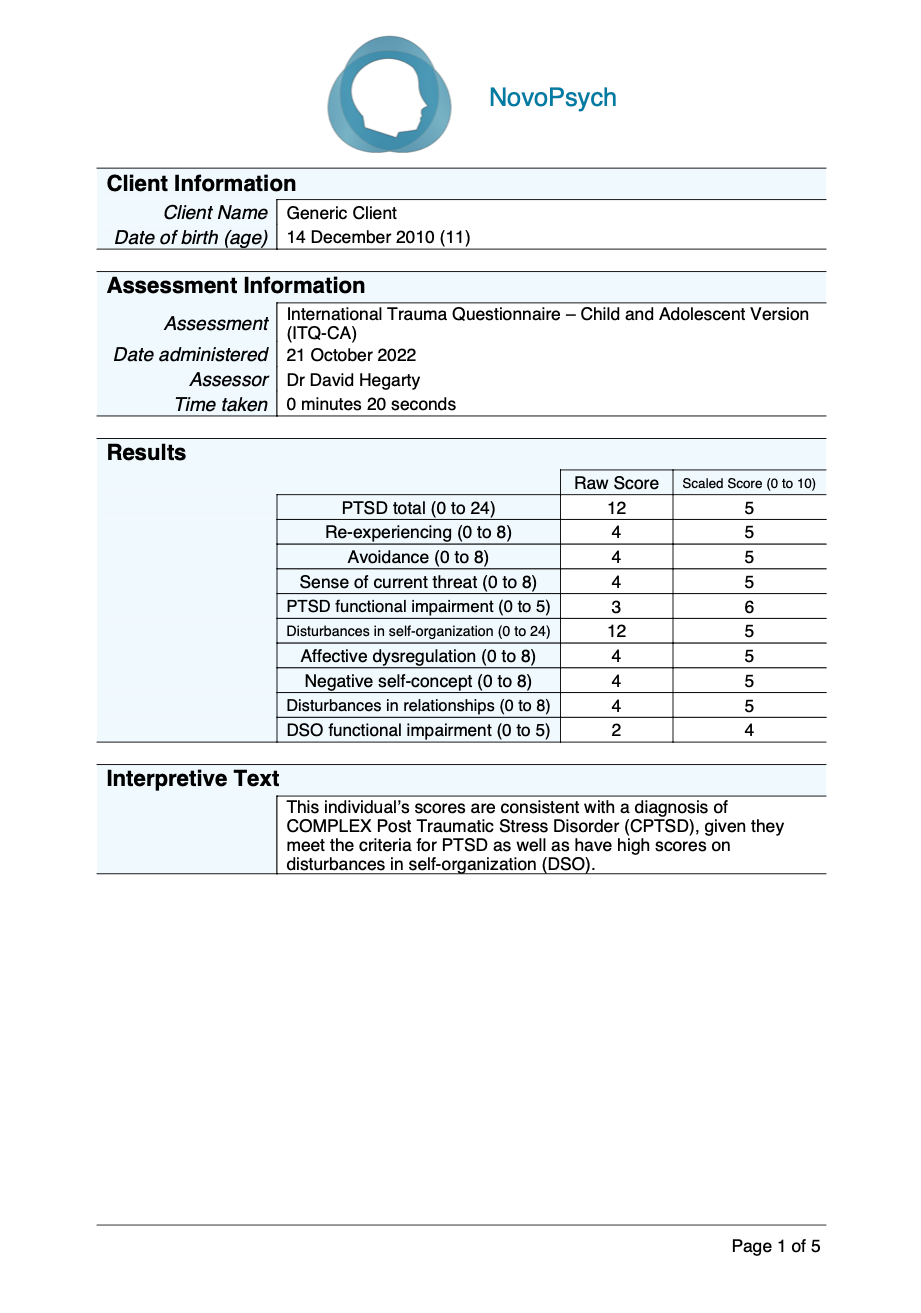
Dimensional scores from 0 to 24 are presented for the two major subscales:

  1. Post Traumatic Stress Disorder (PTSD) (sum of items 1 to 6)
  2. Disturbances in self-organisation (DSO) (sum of items 12 to 17). In addition, the four factors under each major subscale are presented (raw score from 0 to 8).

Note that the functional impairment factors do not count towards the totals of the major subscales. Each score is presented as a raw score and a scaled score. The scaled scores are between 0 and 10 and are calculated by dividing the raw score by the maximum possible score, times 10. The scaled scores are useful for comparison between symptom clusters as they are all scored out of 10. The dimensional scores can be useful in tracking symptoms at the start, middle and end of treatment to ascertain the level of treatment response.

Developer

Cloitre, M., Shevlin, M., Brewin, C. R., Bisson, J. I., Roberts, N. P., Maercker, A., … Hyland, P. (2018). The International Trauma Questionnaire: Development of a self-report measure of ICD-11 PTSD and complex PTSD. Acta psychiatrica Scandinavica, 138(6), 536–546.

References

Haselgruber, A., Sölva, K., & Lueger-Schuster, B. (2020a). Validation of ICD-11 PTSD and complex PTSD in foster children using the International Trauma Questionnaire. Acta Psychiatrica Scandinavica, 141(1), 60–73. https://doi.org/10.1111/acps.13100

Haselgruber, A., Sölva, K., & Lueger-Schuster, B. (2020b). Symptom structure of ICD-11 Complex Posttraumatic Stress Disorder (CPTSD) in trauma-exposed foster children: examining the International Trauma Questionnaire – Child and Adolescent Version (ITQ-CA). European Journal of Psychotraumatology, 11(1), 1818974. https://doi.org/10.1080/20008198.2020.1818974 

Obsessional Compulsive Inventory – Revised (OCI-R)

$
0
0

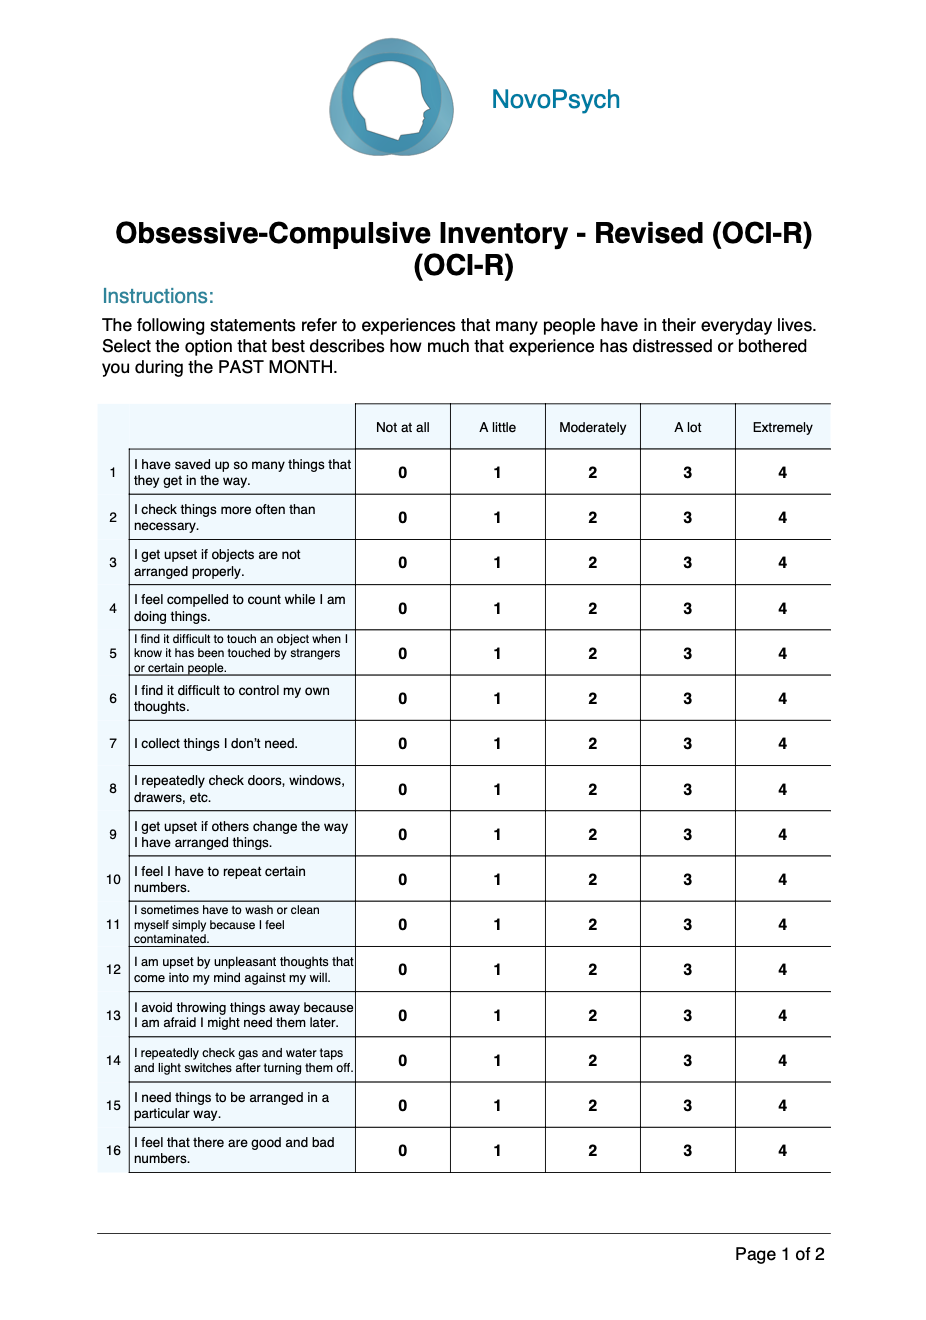
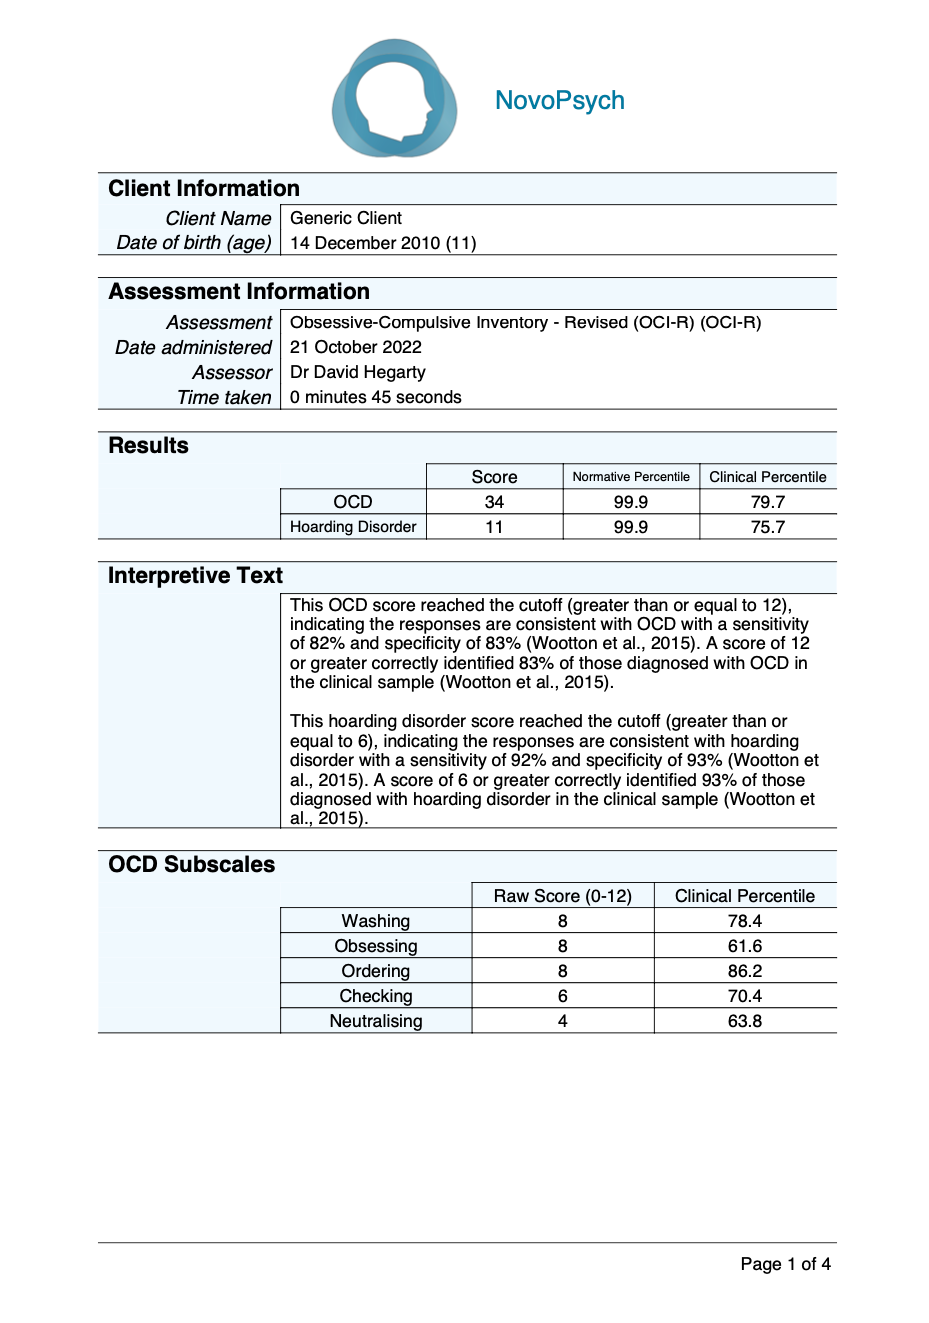
The Obsessive Compulsive Inventory-Revised (OCI-R) (Foa et al., 2002) is an 18-item self-report questionnaire and measures OCD symptoms across 6 subscales including washing, checking, neutralising, obsessing, ordering and hoarding. The scale is suitable for use with adults and adolescents (16 years +; Piqueras et al., 2009).

Although initially developed for assessing OCD (when hoarding disorder was traditionally encapsulated under the OCD diagnosis), more recent research has established two scales to reliably assess both OCD and hoarding disorder (Wootton et al., 2015). The OCI-R can be used as a screening tool, an aid in diagnosis of both OCD and hoarding disorder, or as a tool to monitor progress in therapy.

The OCI-R has the following subscales:

  • Washing – assessing difficulty in touching objects that have been touched before and excessive washing due to feeling contaminated.
  • Obsessing – assessing difficulty with thoughts including trying to control them, becoming upset by unpleasant thoughts, and a feeling of excessive unpleasant thoughts.
  • Ordering – assessing challenges with ordering of objects.
  • Checking – assessing excessive checking of items (doors, windows, drawers, taps, switches).
  • Neutralising – assessing compulsions to count and excessive feelings towards numbers.
  • Hoarding – assesses obtaining and keeping an excessive number of objects that are unneeded and that the client is finding it challenging to get rid of.

Validity and Reliability

The six-factor structure of the OCI-R has been demonstrated consistently across numerous clinical (Gönner et al., 2008; Huppert et al., 2007) and non-clinical samples (Chasson et al., 2013; Solem et al., 2010) and the OCI-R has shown adequate test-retest reliability (Foa et al., 2002; Chasson et al., 2013).

It was found that the OCI-R can be separated into two measures for OCD and hoarding disorder that can differentiate between DSM-5 diagnostic groups (Wootton et al., 2015). The OCD component of the OCI-R correlates more strongly with a measure of anxiety (BAI, r =.61) than with measures of hoarding (SI-R r =.06; HRS r =-.01; Wootton et al., 2015). The hoarding disorder subscale of the OCI-R correlates strongly with the SI-R (r =.94) and HRS (r =.89) and only moderately with a measure of anxiety (BAI, r =.36; Wootton et al., 2015). Cronbach’s alphas for both parts of the OCI-R were high (r = .94 for hoarding disorder and r = .92 for OCD; Wootton et al., 2015).

Receiver operating characteristic (ROC) analyses were conducted in order to ascertain the diagnostic sensitivity (percentage of patients who were accurately identified as having the diagnosis) and specificity (percentage of patients who were accurately identified as not having the diagnosis) of the hoarding disorder and OCD aspects of the ODI-R (Wootton et al., 2015). On the OCD scale a cut score of 12 provided the best balance between sensitivity and specificity, with a false positive rate of 17% and the false negative rate of 18%. The percentage of participants who were correctly classified based on a cut score of 12 was 83%. For the hoarding disorder scale a cutoff score of 6 provided the best balance between sensitivity and specificity. The false positive rate was 7% and the false negative rate was 9%. The percentage of participants who were correctly classified based on a cut score of 6 was 93%.

A sample was used to calculate percentiles for the OCD and hoarding disorder components of the OCI-R. The total sample consisted of 474 adult (age 18 or older) participants (mean age = 47.40; SD = 14.23; 67% female). Of these, 201 had a primary diagnosis of hoarding disorder, 118 had a primary diagnosis of OCD, and 155 were a community sample without a psychiatric diagnosis (Wootton et al., 2015). The means (and SDs) are as follows:

OCD scale (items 2, 3, 4, 5, 6, 8, 9, 10, 11, 12, 14, 15, 16, 17, 18):

  • Clinical (OCD diagnosis): mean = 23.94 (12.11)
  • Normal (community sample): mean = 2.35 (3.54)

Hoarding Disorder subscale (items 1, 7, 13):

  • Clinical (hoarding disorder diagnosis): mean = 9.29 (2.45)
  • Normal (community sample): mean = 1.32 (2.16)

To calculate a clinical percentile for OCD subscales, a sample of 1,339 adults with a primary diagnosis of OCD was used (Abramovitch et al., 2020) and the means (and SDs) are as follows:

  • Washing (items 5, 11, 17): mean = 4.62 (4.30)
  • Obsessing (items 6, 12, 18): mean = 6.89 (3.76)
  • Ordering (items 3, 9, 15): mean = 4.00 (3.68)
  • Checking (items 2, 8, 14): mean = 4.09 (3.56)
  • Neutralising (items 4, 10, 16): mean = 2.77 (3.49)

Scoring and Interpretation

For the OCD component of the OCI-R (items 2, 3, 4, 5, 6, 8, 9, 10, 11, 12, 14, 15, 16, 17, 18), the total score ranges from 0 – 60, with higher scores indicative of more severe OCD symptoms. A cutoff score of 12 is used to determine the likelihood of an OCD diagnosis (with a sensitivity of 82% and specificity of 83%).

Normative and clinical percentiles are presented comparing the respondent’s scores to other adults (Wootton et al., 2015). A normative percentile rank of 50 indicates an average level of OCD symptoms in comparison to the the general population, and is indicative of typical (and healthy) levels of symptomatology. A clinical percentile rank of 50 indicates an average level of OCD symptoms in comparison to the clinical group (with an OCD diagnosis), and is indicative of elevated levels of symptomatology.

For the hoarding disorder subscale of the OCI-R (items 1, 7, 13), the total score ranges from 0 – 12, with higher scores indicative of more severe hoarding symptoms. A cutoff score of 6 is used to determine the likelihood of a hoarding disorder diagnosis (with a sensitivity of 92% and specificity of 93%).

A normative and clinical percentile are presented comparing the respondent’s scores to other adults (Wootton et al., 2015). A normative percentile rank of 50 indicates an average level of hoarding symptoms in comparison to the normative group, and is indicative of typical (and healthy) levels of symptomatology. A clinical percentile rank of 50 indicates an average level of OCD symptoms in comparison to the clinical group (with a hoarding disorder diagnosis), and is indicative of elevated levels of symptomatology.

The OCD component of the OCI-R also reports the client’s score (between 0 – 12) across 6 subscales, with a clinical percentiles comparing the respondent’s scores to a comparison group whom have received a OCD diagnosis (Abramovitch et al., 2020):

  • Washing (items 5, 11, 17) – assessing difficulty in touching objects that have been touched before and excessive washing due to feeling contaminated.
  • Obsessing (items 6, 12, 18) – assessing difficulty with thoughts including trying to control them, becoming upset by unpleasant thoughts, and a feeling of excessive unpleasant thoughts.
  • Ordering (items 3, 9, 15) – assessing challenges with ordering of objects.
  • Checking (items 2, 8, 14) – assessing excessive checking of items (doors, windows, drawers, taps, switches).
  • Neutralising (items 4, 10, 16) – assessing compulsions to count and excessive feelings towards numbers.

Developer

Foa, E. B., Huppert, J. D., Leiberg, S., Langner, R., Kichic, R., Hajcak, G., & Salkovskis, P. M. (2002). The Obsessive-Complusive Inventory: Development and validation of a short version. Psychological Assessment, 14(4), 485–495. https://doi.org/10.1037//1040-3590.14.4.485

Reference

Abramovitch, A., Abramowitz, J. S., Riemann, B. C., & McKay, D. (2020). Severity benchmarks and contemporary clinical norms for the Obsessive-Compulsive Inventory-Revised (OCI-R). Journal of Obsessive-Compulsive and Related Disorders, 27, 100557. https://doi.org/10.1016/j.jocrd.2020.100557

Chasson, G. S., Tang, S., Gray, B., Sun, H., & Wang, J. (2013). Further validation of a Chinese version of the Obsessive-Compulsive Inventory-Revised. Behavioural and cognitive psychotherapy, 41(2), 249–254. https://doi.org/10.1017/S1352465812000379

Gönner, S., Leonhart, R., & Ecker, W. (2008). The Obsessive-Compulsive Inventory-Revised (OCI-R): validation of the German version in a sample of patients with OCD, anxiety disorders, and depressive disorders. Journal of anxiety disorders, 22(4), 734–749. https://doi.org/10.1016/j.janxdis.2007.07.007

Huppert, J. D., Walther, M. R., Hajcak, G., Yadin, E., Foa, E. B., Simpson, H. B., & Liebowitz, M. R. (2007). The OCI-R: validation of the subscales in a clinical sample. Journal of anxiety disorders, 21(3), 394–406. https://doi.org/10.1016/j.janxdis.2006.05.006

Rodríguez, J. A. P., González, A. E. M., Montesinos, M. D. H., Rivas, M. Á. F., Mataix-Cols, D., & Alcázar, A. I. R. (2009). Psychometric properties of the Obsessive Compulsive Inventory-Revised in a non-clinical sample of late adolescents. Behavioral Psychology, 17(3), 561–572. https://www.researchgate.net/publication/229433233

Solem, S., Hjemdal, O., Vogel, P. A., & Stiles, T. C. (2010). A Norwegian version of the Obsessive-Compulsive Inventory-Revised: psychometric properties. Scandinavian journal of psychology, 51(6), 509–516. https://doi.org/10.1111/j.1467-9450.2009.00798.x
Wootton, B. M., Diefenbach, G. J., Bragdon, L. B., Steketee, G., Frost, R. O., & Tolin, D. F. (2015). A contemporary psychometric evaluation of the Obsessive Compulsive Inventory-Revised (OCI-R). Psychological Assessment, 27(3), 874–882. https://doi.org/10.1037/pas0000075 

Sleep Hygiene Index (SHI)

$
0
0

The Sleep Hygiene Index is a 13 item self administered index used to assess the presence of behaviours that are thought to compromise sleep quality such as “I take daytime naps lasting two or more hours” “I think, plan or worry when I am in bed” and ”I get out of bed at different times from day to day”. The Sleep Hygiene Index can be used in those 17 years and above.

Sleep Hygiene may be described as practicing behaviours that facilitate sleep and avoiding behaviours that interfere with sleep (Mastin, Bryson, & Corwyn, 2006; Riedel 2000). Poor sleep hygiene is associated with poor sleep quality (Brick et al., 2010; Suen, Tam and Hon, 2010; Gellis, & Lichstein, 2009). Paying attention to sleep hygiene is one of the most straightforward ways you can help your clients get a better sleep.

The Sleep Hygiene Index is a useful clinical assessment tool for evaluating sleep hygiene to guide case formulation, treatment planning, or the progress of interventions.

Poor sleep health is common, with a prevalence of 20-29% in adults (Australian Institute of Health and Welfare, 2021). Poor sleep can seriously affect a person’s quality of life, and is associated with daytime impairments such as fatigue, irritability and poor mood, and increased risk for major depression. Insomnia co-occurs with most psychological disorders (Khurshid, 2018) and therefore is important for clinicians to be aware of behaviours that may be contributing to poor sleep quality.

In high school, poor sleep hygiene was associated with lower grades (Harsh, 2011). Declines in sleep hygiene for students across the college years was also associated with a decline in grades. Therefore being aware of sleep hygiene habits will be important for clinicians in supporting young people. In addition, sleep hygiene is one of the first things to check when patients with chronic pain complain about poor sleep quality (Cho, Kim, & Lee, 2013).

Validity and Reliability

The Sleep Hygiene Index has illustrated satisfactory reliability and validity (Mastin, Bryson, & Corwyn, 2006). The items for the Sleep Hygiene Index were constructed from the diagnostic criteria for inadequate sleep hygiene in the International Classification of Sleep Disorders (American Sleep Disorders Association. 1990). There were 603 complete data sets for the Sleep Hygiene Index, participants were non-clinical volunteering psychology university students from a mid-sized university in the United States (M = 34.66) and (SD = 6.6) with a range from 17–55. Cronbach’s α for the Sleep Hygiene Index (α = 0.66) was found to be superior to previously published sleep hygiene instruments, the Sleep Hygiene Index was found to have good test–retest reliability (r(139) = 0.71, p < 0.01).

The Sleep Hygiene was found to have adequate validity, it was positively correlated with all features of inadequate sleep hygiene (American Sleep Disorders Association. 1990). The Sleep Hygiene Index was also correlated positively with the Epworth Sleepiness Scale (r(599) = 0.244, p < 0.01), and the Pittsburgh Sleep Quality Index total score (r(269) = 0.481, p < 0.01), which suggests that poor sleep hygiene is related to poor sleep quality and more daytime sleepiness.

At Hendrick’s College, the Sleep hygiene Index was administered to 17-20 year old’s prior to starting their college degree (N=89) (Harsh, 2011). Participants gave access to their high school and college academic records, as well as completed questionnaires regarding their High school sleep. Participants then completed the measures at the end of their first year of college (N=39) and the end of their senior year (N=43) of college. In high school, poor sleep hygiene was associated with lower grades (r(80)=-.277; p<.05). Declines in sleep hygiene for students across the college years was also associated with a decline in grades.

The Sleep hygiene Index has been validated in participants with chronic pain (Cho, Kim, & Lee, 2013). A total of 161 patients seeking treatment for chronic pain in Seoul, Korea participated in the study. Results of this study showed that the internal consistencies (α = 0.75) and test–retest stability estimates of the Sleep Hygiene Index were deemed acceptable and relatively high compared to the original study.

Normative data

  • University sample (N= 603) mean 34.7 (SD = 6.6) range 17-55 (Mastin, Bryson, & Corwyn, 2006).
  • Hendrix College sample (17-20 year olds) (N=133) mean=35 (SD=4.5) (Harsh, 2011).
  • Junior Doctors in India (N=350) mean=32 (SD=6) (Mastin, Siddalingaiah, Singh, & Lal, 2012).

Scoring and Interpretation

Total scores range from 0 to 52 – with a higher score representing more behaviours that are compromising sleep hygiene.

Scores are also presented as a percentile rank, comparing the respondents scores against those of a normative sample (Mastin, Bryson, & Corwyn, 2006). Percentiles above 50 represent more problematic sleep behaviours than average, to the extent that they are likely contributing to poor sleep quality.

Scores below 26 are considered as good, 27-34 as normal, and 35 and above (indicated by a dotted line on the graph) are considered as poor sleep hygiene (Mastin et al. 2012).

When interpreting the Sleep Hygiene Index, it is important to consider that sleep hygiene does not exist in isolation. It is important for clinicians to use clinical judgement to understand the psychosocial context of the patient, as precipitating and maintaining factors of poor sleep hygiene behaviours may not be addressed by sleep education alone (Mastin, Bryson, & Corwyn, 2006).

Developer

Mastin, D. F., Bryson, J., & Corwyn, R. (2006). Assessment of sleep hygiene using the Sleep Hygiene Index. Journal of behavioral medicine, 29(3), 223-227.

Reference

American Sleep Disorders Association, & Diagnostic Classification Steering Committee. (1990). The international classification of sleep disorders: diagnostic and coding manual. American Sleep Disorders Association.

Australian Institute of Health and Welfare. (2021). Sleep problems as a risk factor for chronic conditions.
https://www.aihw.gov.au/reports/risk-factors/sleep-problems-as-a-risk-factor/summary

Brick, C. A., Seely, D. L., & Palermo, T. M. (2010). Association between sleep hygiene and sleep quality in medical students. Behavioral sleep medicine, 8(2), 113-121.

Cho, S., Kim, G. S., & Lee, J. H. (2013). Psychometric evaluation of the sleep hygiene index: a sample of patients with chronic pain. Health and quality of life outcomes, 11(1), 1-7.

Deloitte Access Economics. (2021).
Re-awakening Australia: The economic cost of sleep disorders in Australia.
https://www2.deloitte.com/au/en/pages/economics/articles/sleep-health.html

Gellis, L. A., & Lichstein, K. L. (2009). Sleep hygiene practices of good and poor sleepers in the United States: an internet-based study. Behavior Therapy, 40(1), 1-9.

Harsh, J. R. (2011). Sleep Hygiene, Chronotype and Academic Performance During the Transition from High School Through Four Years of College. Sleep, 34, A81.

Khurshid, K. A. (2018). Comorbid insomnia and psychiatric disorders: an update. Innovations in clinical neuroscience, 15(3-4), 28.

Mastin, D. F., Bryson, J., & Corwyn, R. (2006). Assessment of sleep hygiene using the Sleep Hygiene Index. Journal of behavioral medicine, 29(3), 223-227.

Mastin, D. F., Siddalingaiah, H. S., Singh, A., & Lal, V. (2012). Excessive daytime sleepiness, sleep hygiene, and work hours among medical residents in India. Journal of Tropical Psychology, 2.

Suen, L. K., Tam, W. W., & Hon, K. L. (2010). Association of sleep hygiene-related factors and sleep quality among university students in Hong Kong. Hong Kong Med J, 16(3), 180-5.

Zagaria, A., Ballesio, A., Musetti, A., Lenzo, V., Quattropani, M. C., Borghi, L., … & Franceschini, C. (2021). Psychometric properties of the Sleep Hygiene Index in a large Italian community sample. Sleep Medicine, 84, 362-367.

Composite Caregiving Questionnaire (CCQ)

$
0
0

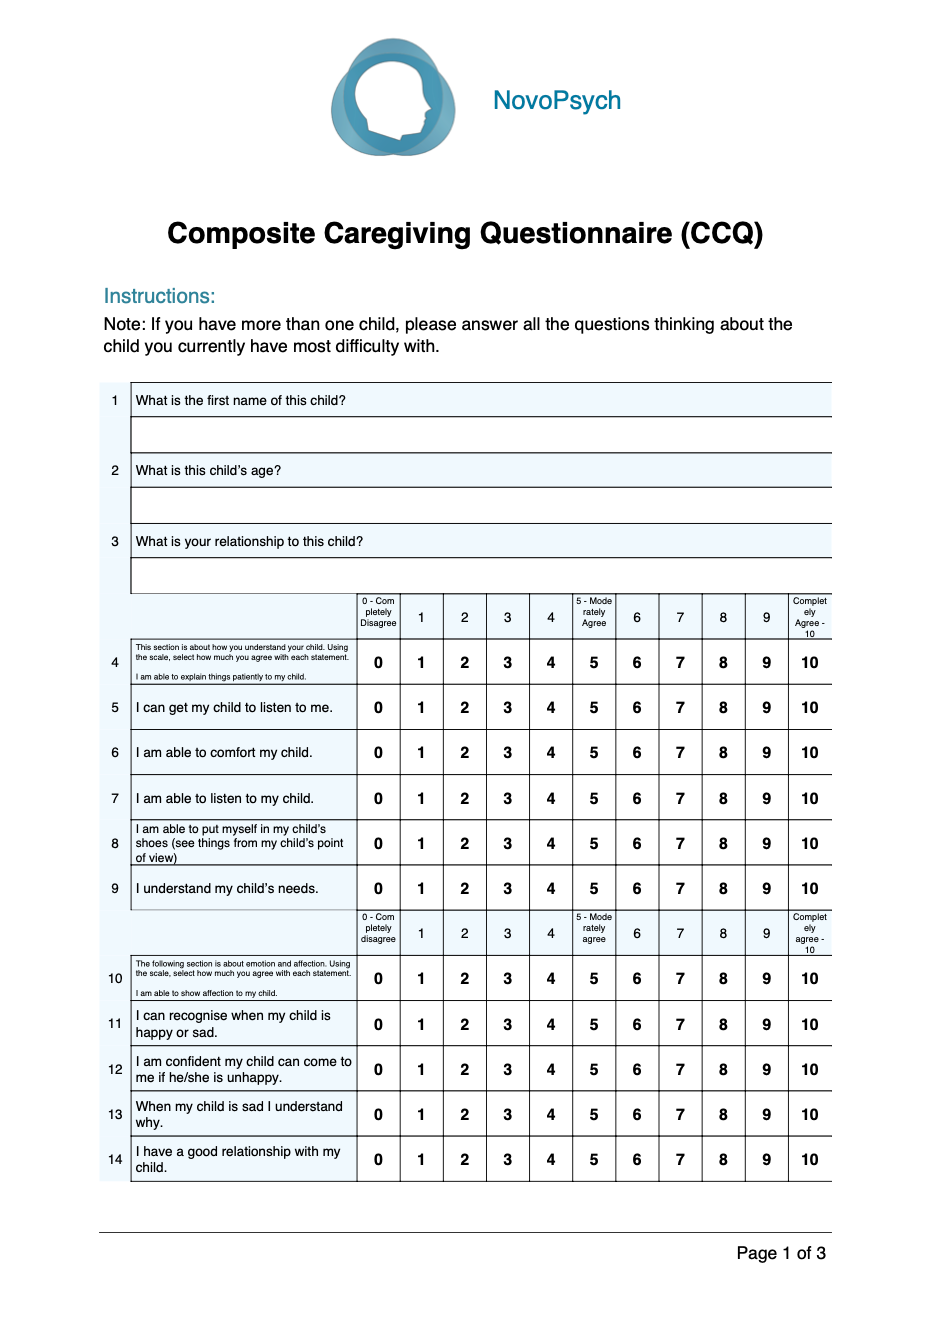
The Caregiving Composite Questionnaire (CCQ) is a 42-item questionnaire completed by parents/caregivers of children aged 0 to 6 years. It measures five parenting constructs that are important in reducing attachment insecurity and promoting attachment security in young children: 

  1. Parenting self-efficacy in empathy
  2. Parenting self-efficacy in expressing affection and managing child emotion
  3. Caregiving helplessness
  4. Hostile perceptions of the child
  5. Parent mentalisation

The CCQ is intended to provide clinicians with information about caregivers’ perceptions of their caregiving role and their thoughts and feelings about their child.  It is not designed to categorise parent-child attachment relationships, but it provides important information about factors related to child attachment security that can inform the assessment process and help with treatment planning. The CCQ can also be used to monitor outcomes of attachment-based treatments that are focused on shifting the cognitive aspects of caregiving associated with attachment security. 

Validity and Reliability

The CCQ is made up of 5 subscales selected from already validated measures that assess constructs associated with attachment security in young children. Subscales were selected because of their ease of administration and scoring and theoretical alignment with precursors of attachment relationships (Maxwell, McMahon, Huber, Reay et al., 2021). Original scale authors granted permission for each subscale to be included in this composite questionnaire. The information below shows the origins of questionnaire items and subscales. Questionnaire items aimed at parents of infants were reworded to be relevant for parents of children 0 – 6 years.

  • Empathy & Understanding: taken from empathy and understanding subscale of the Tool to Measure Parenting Self-Efficacy (TOPSE; Kendall & Bloomfield, 2005). Items = 6.
  • Emotion & Affection: taken from emotion and affection subscale of the TOPSE (Kendall & Bloomfield, 2005). Items = 6.
  • Caregiving Helplessness: taken from Helpless subscale of Caregiving Helplessness Questionnaire (CHQ; George & Solomon, 2011). Items = 7
  • Hostility: taken from Hostile Parenting scale, The Longitudinal Study of Australian Children (LSAC; 2006). Items = 5
  • Parental Mentalising: taken from Diamond Maternal Reflective Functioning Scale (Diamond et al. 2013). Items = 18

Parent self-efficacy. The initial TOPSE development study suggested good internal consistency of each subscale, with good internal consistency for the empathy (alpha = 0.89) and affection subcales (alpha = 0.81) in a sample of 63 parents of children 0 – 6 years (Kendall & Bloomfield, 2005). A systematic review of self-reported parenting self-efficacy measures also concluded that the TOPSE had good content validity and acceptable construct validity (Wittkowski et al., 2017). 

Caregiving helplessness.  The original scale development study revealed good factor structure for the measure’s three subscales in a sample of 208 mothers of children aged 3 – 11 years. The helpless subscale showed good internal consistency (alpha = 0.85), and convergent and divergent validity in a smaller subset of the larger sample (George & Solomon, 2011). Specifically, the helpless subscale was significantly related to helplessness ratings from interviews, and not significantly related to mothers’ stress levels in non-caregiving domains, such as stress about health. A subsequent validation study showed good internal consistency of the helpless subscale with mothers of infants (alpha = 0.80; Huth-Bocks, Guyon-Harris, Calvert, Scott & Harris, 2016), and good convergent validity with concurrent measures of maternal risk factors and infant problems. The helpless subscale was correlated with maternal BDI-II depression (r = 0.53), maternal PCL post-traumatic stress symptoms (r = 0.53), and infant problems as measured by the BITSEA (r = 0. 32).

Hostility. The hostility subscale was developed for use in the Longitudinal Study of Australian Children (LSAC, 2006), which is a large, longitudinal study following the development of 10,000 children and families from all parts of Australia. It has shown good internal consistency, with H coefficients ranging from 0.85 to 0.92 across multiple waves of the LSAC (Giallo, Cooklin, Wade, D’Esposito, & Nicholson, 2013). It has also shown predictive validity with significant associations with child outcomes in major population-based studies.

Parental mentalising. The parent mentalising scale was developed and validated on a sample of 219 mothers of infants (Diamond, Caltabiano, Caltabiano, & Goodman, 2013). It showed acceptable internal consistency and evidence of convergent and divergent validity.  

The CCQ was piloted for use as a tool for monitoring outcomes of attachment-based interventions in a non-randomized waitlist control trial examining the effectiveness of Circle of Security Parenting (Maxwell, McMahon, Huber, Reay et al., 2021).  In this sample of 255 parents of children aged 0-6 years, internal consistency of all subscales was good (alphas ranged from 0.78 to 0.88). Associations among subscales aligned as expected, supporting convergent validity of the subscales. For example, hostility was positively correlated with caregiving helplessness (r = 0.56) and negatively with empathy (r = -0.40) and affection (r = -0.38); empathy was positively correlated with affection (r = 0.66); caregiving helplessness was negatively correlated with empathy (r = -0.57) and affection (r = -0.50); and parent mentalising was positively correlated with empathy (r = 0.45) and affection (r = 0.30). All subscales successfully differentiated treatment from waitlist control group in the study, and all were sensitive to change in the intervention group.

A study by Byron & Hawkins (2022) using the CCQ with a community sample of 80 parents/caregivers of children aged between 1 and 4 (mean age 2) found the following means (and standard deviations):

  • Empathy & Understanding: mean = 48.3 (9.3)
  • Emotion & Affection: mean = 54.7 (9.98)
  • Hostility: mean = 11.6 (9.2)
  • Caregiving Helplessness: mean = 9.4 (3.4)
  • Parental Mentalising: mean = 37.7 (6.2)

Scoring and Interpretation

Each scale of the CCQ is scored separately. A total score is not computed.

  • Empathy & Understanding (items 4 – 9): a total raw score from 0 – 60. A higher score indicates more empathic parenting. A cutoff score below 38 indicates possible clinical concern.
  • Emotion & Affection (items 10 – 15; item 15 is reverse-scored): a total raw score from 0 – 60. A higher score indicates more affectionate parenting. A cutoff score below 47 indicates possible clinical concern.
  • Hostility (items 16 – 20): a total raw score from 0 – 50. A high score indicates more parental hostility. A cutoff score of above 21 indicates possible clinical concern. 
  • Caregiving Helplessness (items 21 – 27): a total raw score from 7 – 35. A high score indicates more parental helplessness. A cutoff score of above 16 indicates possible clinical concern.
  • Parental Mentalising (items 28 – 45; items 31, 36, 41 are reverse-scored): a total raw score from 0 – 54. A high score indicates keeping the child more in mind and thinking about own childhood more. A cutoff score below 31 indicates possible clinical concern. The Parental Mentalising scale has three subscales:
    • Cue Recognition (items 28, 31, 33, 36, 39, 41, 44): being aware of the child’s needs and wants
    • Mentalisation of Infant (items 29, 32, 35, 37, 40, 43, 45): being aware of child’s own internal world
    • Own Childhood Experience (items 30, 34, 38, 42): an awareness of the parents’ own childhood experiences

Normative percentiles are presented from a community sample of parents/caregivers of children aged between 1 and 4 (Byron & Hawkins, 2022). A percentile of 50 indicates that the individual’s scores are average when compared to other parents/caregivers. 

A scaled score (out of 10) is presented for the Parental Mentalising subscales so that a comparison can be made between them (given there are different numbers of items between each one).  

Reference

Byron B. & Hawkins E. (2022). [unpublished data].

Diamond, C. S., Caltabiano, N. J., Caltabiano, M., & Goodman, D. (2013). Maternal reflective function scale: the development of a scale for primary health care services. Archives of Women’s Mental Health, 16, 14-14.   

Giallo, R., Cooklin, A., Wade, C., D’Esposito, F., & Nicholson, J. M. (2013). Maternal postnatal mental health and later emotional-behavioural development of children: The mediating role of parenting behaviour. Child: Care, Health and Development, 40(3), 327-336. https://doi.org/10.1111/cch.12028

George, C., & Solomon, J. (2011). Caregiving helplessness: The development of a screening measure for disorganized maternal caregiving. In J. Solomon & C. George (Eds.), Disorganized attachment and caregiving (pp. 133-166). New York: Guilford Press.

Huth-Bocks, A. C., Guyon-Harris, K., Calvert, M., Scott, S., & Ahlfs-Dunn, S. (2016). The caregiving helplessness questionnaire: Evidence for validity and utility with mothers of infants. Infant Mental Health Journal, 37(3), 208-221. https://doi.org/10.1002/imhj.21559

Kendall, S., & Bloomfield, L. (2005). Developing and validating a tool to measure parenting self-efficacy. Journal of Advanced Nursing, 51(2), 174-181. https://doi.org/10.1111/j.1365-2648.2005.03479.x

Maxwell, AM., McMahon, C., Huber, A. et al. Examining the Effectiveness of Circle of Security Parenting (COS-P): A Multi-Site Non-Randomized Study with Waitlist Control. J Child Fam Stud 30, 1123–1140 (2021). https://doi.org/10.1007/s10826-021-01932-4

Wittkowski, A., Garrett, C., Calam, R., & Weisberg, D. (2017). Self-report measures of parental self-efficacy: A systematic review of the current literature. Journal of Child and Family Studies, 26(11), 2960-2978. https://doi.org/10.1007/s10826-017-0830-5

Pediatric Symptom Checklist-17 (PSC-17)

$
0
0

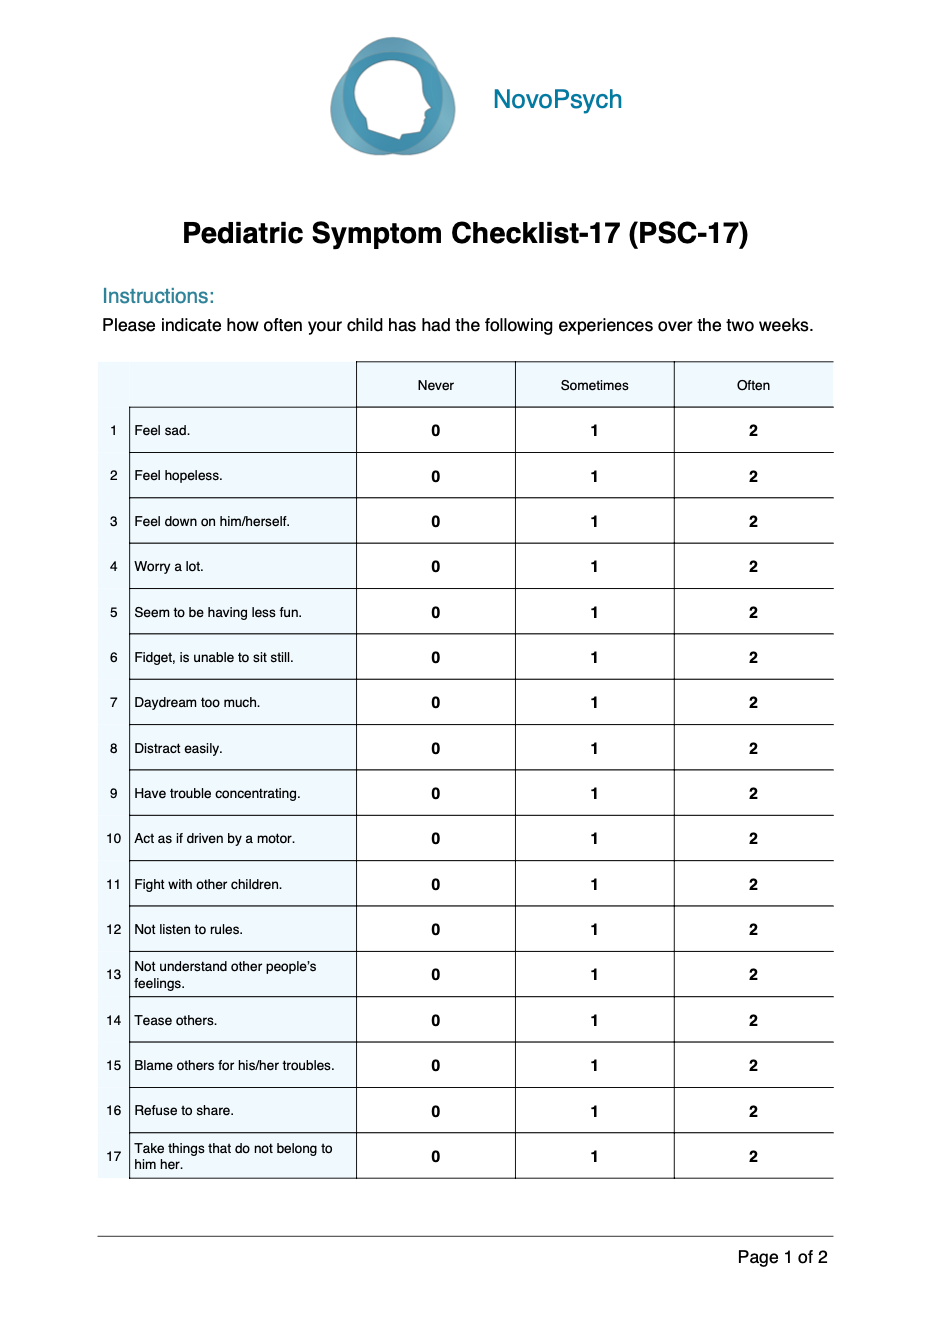
The Pediatric Symptom Checklist-17 (PSC-17) is a psychosocial screening tool designed to facilitate the recognition of cognitive, emotional, and behavioural problems so that appropriate interventions can be initiated as early as possible. It is rated by a parent or guardian on behalf of the child and is appropriate for use with children between 4 and 15 years of age. It has three subscales:

  • Internalising – a measure of internalising problems such as anxiety or depression.
  • Attention – a measure of attentional problems.
  • Externalising – a measure of externalising problems.

Validity and Reliability

The PSC-17 has been validated with 723 youth in paediatric settings with mothers as rater (Stoppelbein et al. 2012). Confirmatory factor analyses revealed three factors and cut-off scored were identified by comparison with longer standardised assessments. The PSC-17 has good internal reliability for the total score (Cronbach’s alpha = 0.89) and all three subscales (0.79, 0.83, 0.83 respectively; Gardner et al., 1999).

Normative data was collected from a sample of 322 children (aged 6-16 years of age) without any chronic illness or developmental delays from a variety of ethnic backgrounds (Stoppelbein et al., 2012). The means (and standard deviations) were as follows:

  • Total Score: Mean = 6.74 (5.62)
  • Internalising: Mean = 1.27 (1.71)
  • Attention: Mean = 2.67 (2.43)
  • Externalising: Mean = 2.78 (2.78)

Scoring and Interpretation

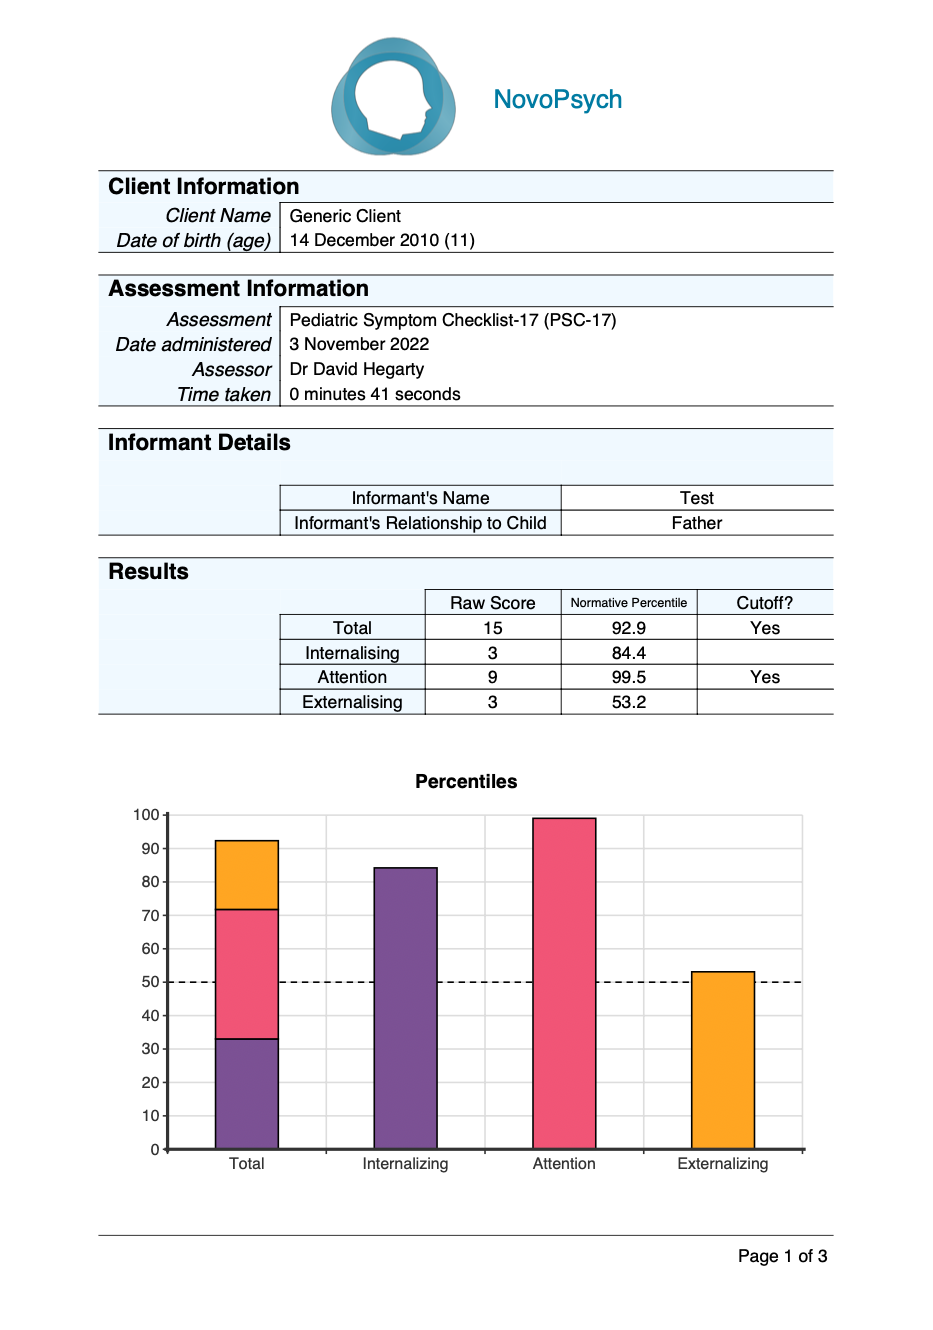
A total PSC-17 score of 15 or higher suggests the presence of significant behavioural or emotional problems requiring comprehensive assessment. There are also cutoff scores for three subscales that suggest a more comprehensive assessment is advisable:

  1. Internalising Subscale (Clinical cutoff = 5 or higher). Items 1, 2, 3, 4, 5
  2. Attention Subscale (Clinical cutoff = 7 or higher). Items 6, 7, 8, 9, 10
  3. Externalising Subscale (Clinical cutoff = 7 or higher). Items 11, 12, 13, 14, 15, 16, 17

In addition to the raw score, a normative percentile is presented comparing the respondent’s scores to those of a healthy community sample (Stoppelbein et al., 2012). A percentile of 50 indicates the client has scored at an average (and healthy) level compared to the normative comparison group. Higher percentiles represent higher levels of reported difficulties, where a total score percentile of 92.9 or above corresponds to scores of clinical concern (15 plus).  

Developer

Gardner, W., Murphy, M., Childs, G., Kelleher, K., & Sturner, R. (1999). The PSC-17: a brief Pediatric Symptom Checklist with psychosocial problem subscales. A report from PROS and ASPN. Ambulatory Child Health, 5(3), 225–236.

Reference

Murphy, J. M., Bergmann, P., Chiang, C., Sturner, R., Howard, B., Abel, M. R., & Jellinek, M. (2016). The PSC-17: Subscale Scores, Reliability, and Factor Structure in a New National Sample. Pediatrics, 138(3). https://doi.org/10.1542/peds.2016-0038

Stoppelbein, L., Greening, L., Moll, G., Jordan, S., & Suozzi, A. (2012). Factor analyses of the Pediatric Symptom Checklist-17 with African-American and Caucasian pediatric populations. Journal of Pediatric Psychology, 37(3), 348–357. https://doi.org/10.1093/jpepsy/jsr103

Positive and Negative Affect Schedule (PANAS)

$
0
0

The Positive and Negative Affect Schedule (PANAS; Watson et al., 1988) is a 20-item self- report measure to assess positive affect (PA) and negative affect (NA). PA is associated with pleasurable engagement with the environment, whereas NA reflects a dimension of general distress summarising a variety of negative states such as anger, guilt, or anxiety. The PANAS is a useful tool for therapists who are interested in tracking changes in positive and negative emotions for clients from week to week as they engage in day-to-day life. The PANAS is sensitive to momentary changes in affect and can be used to chart the immediate effects of therapy sessions as well as outcomes associated with positive psychological interventions, exercises, or activities.

Psychometric Properties

The PANAS has been reported to have very good internal consistency reliability, with alphas ranging from 0.85 to 0.90 for Positive Affect and from 0.84 to 0.87 for Negative Affect (Crawford & Henry, 2004; Heubeck & Wilkinson, 2019). Test–retest reliability is good over an 8-week time period, with correlations of 0.54 for momentary Positive Affect, 0.45 for momentary Negative Affect.

Since the introduction of the PANAS, many studies examined its factorial validity using exploratory (EFA) or confirmatory factor analysis (CFA) and have come to different conclusions about which measurement model fits best (Wedderhoff et al., 2021). A meta- analysis from 47 independent studies using over 54,000 participants (Wedderhoff et al., 2021) found a correlated two-factor model including error correlations within content categories provided the best fit for all samples.

Based upon a large sample of non-clinical Australian adult (18 to 50 years old) respondents on both the state (n = 1059) version of the PANAS (Heubeck & Wilkinson, 2019), means and standard deviations were determined:

  • Positive Affect: 26.48 (8.1)
  • Negative Affect: 14.80 (5.49)

Scoring and Interpretation 

The PANAS score is separated into the Positive Affect (PA) and Negative Affect (NA) scores, with a higher score indicating more positive or negative affect respectively. Note, that although a very high score on the PA scale is worthy of attention (i.e. manic patients will typically score very highly on PA), the principal clinical concern will be with patients who show very low levels of positive affect (i.e. are anhedonic) and thus obtain low percentile ranks. In contrast, a high score on the NA (and a high percentile) is an indicator of psychological distress.

Normative data was collected from over 1,000 Australian adults and is used to calculate percentiles. A percentile rank of 50 indicates an average level of positive or negative affectivity in comparison to the normative group.

There are two subscales of the PANAS:

  1. Positive Affect (items 1, 3, 5, 9, 10, 12, 14, 16, 17, and 19). Higher scores represent higher levels of PA and are associated with pleasurable engagement with the environment.
  2. Negative Affect Sore (items 2, 4, 6, 7, 8, 11, 13, 15, 18, and 20). Higher scores represent higher levels of NA and reflect a dimension of general distress summarising a variety of negative states such as anger, guilt, or anxiety.

Developer

Watson, D., Clark, L. A., & Tellegen, A. (1988). Development and validation of brief measures of positive and negative affect: The PANAS scales. Journal of Personality and Social Psychology, 54(6), 1063–1070. https://doi.org/10.1037/0022-3514.54.6.1063

References

Crawford, J. R., & Henry, J. D. (2004). The positive and negative affect schedule (PANAS): construct validity, measurement properties and normative data in a large non-clinical sample. The British Journal of Clinical Psychology / the British Psychological Society, 43(Pt 3), 245–265. https://doi.org/10.1348/0144665031752934

Heubeck, B. G., & Wilkinson, R. (2019). Is all fit that glitters gold? Comparisons of two, three and bi-factor models for Watson, Clark & Tellegen’s 20-item state and trait PANAS. Personality and Individual Differences, 144, 132–140. https://doi.org/10.1016/j.paid.2019.03.002

Personal Wellbeing Index – Adult – 5 (PWI-A)

$
0
0

The Personal Wellbeing Index (PWI 5th edition; International Wellbeing Group, 2013) is a 9-item self-report questionnaire that asks people to rate how satisfied they are with different domains of their lives. The PWI is recommended by both the WHO and OECD as a preferred tool for measuring Subjective Wellbeing among adults. The scale is useful for monitoring self-reported quality of life over time particularly in non-psychiatric settings.

Validity and Reliability

The Personal Wellbeing Index was created from the Comprehensive Quality of Life Scale by Cummins et al. (2013). The scale has been comprehensively validated for use among adults across the age range in Australia. Khor et al. (2020) provided normative data for the PWI in a sample of 65,722 Australian adults, showing a mean score of 75.3 (SD = 12.6).

Scoring and Interpretation

Scores consist of the single PWI score presented as a standard score between 0 and 100. The first (optional) question does not form part of the scoring. Standard scores are computed by dividing the raw score by 7 (or 8 if the optional last item is completed), times by 100. Higher scores are indicative of higher levels of personal wellbeing, quality of life and mental health.

Scores are also presented a percentile compared to an Australian adult population (Khor et al., 2020). The percentile represents how an individual scored compared to peers, where a percentile of 50 indicates average wellbeing and a percentile of 10 represents wellbeing in the bottom 10 percentile of the population.

Individual scores on the PWI can be interpreted using the following guidelines (Tomyn, Weinberg, & Cummins, 2015):

  • 70+ = ‘normal’ levels of Subjective Wellbeing.
  • 50 – 69 = ‘compromised’ levels of Subjective Wellbeing
  • 49 or less = ‘challenged’ level of Subjective Wellbeing

An individual with compromised welling scores (69 or less) is likely to be experiencing challenges to their level of subjective wellbeing, possibly due to life circumstances or current challenges (e.g., to their health, work status, or relationships, etc), or due to the presence of symptoms of mental ill-health (e.g., depression).

The item “Satisfaction with life as a whole” (Question 1) is not a component of the Personal Wellbeing Index (PWI) score and the last item (Question 9) is only scored if it is relevant for the client and a response indicated.

Developer

International Wellbeing Group (2013). Personal Wellbeing Index: 5th Edition. Melbourne: Australian Centre on Quality of Life, Deakin University http://www.acqol.com.au/instruments#measures

Reference

Khor, S., Cummins, R.A., Fuller-Tyszkiewicz, M., Capic, T., Jona, C., Olsson, C.A., & Hutchinson, D. (2020). Australian Unity Wellbeing Index: – Report 36: Social connectedness and wellbeing. Geelong: Australian Centre on Quality of Life, School of Psychology, Deakin University. http://www.acqol.com.au/projects#reports

Tomyn, A. J., Weinberg, M. K., & Cummins, R. A. (2015). Intervention efficacy among ‘at risk’adolescents: a test of subjective wellbeing homeostasis theory. Social Indicators Research, 120(3), 883-895.


Wender Utah Rating Scale – 25 item version (WURS-25)

$
0
0

The Wender Utah Rating Scale – 25 item version (WURS-25) is a self-report instrument that is designed to retrospectively evaluate the presence and severity of childhood symptoms of ADHD in adults (18+; Ward et al., 1993).

Most of the items in the WURS-25 are not directly tapping into core ADHD symptoms, instead, the items were chosen for their discriminative ability in distinguishing between adults with and without an ADHD diagnosis (Brevik et al., 2020). The WURS-25 has three subscales that provide an indication of the problems experienced by the adult in childhood:

  1. Impulsivity & Behavioural problems
  2. Inattentiveness & School problems
  3. Self Esteem & Negative mood

The WURS-25 is an important adjunct for diagnosis of ADHD in adults given the requirement for childhood onset (American Psychiatric Association, 2013). This scale is useful for screening and diagnosis of ADHD among adults 18+ and can be particularly useful when used in conjunction with the ASRS to provide additional clinical information (Brevik et al., 2020).

It is important to diagnose adults with ADHD given that adult ADHD is associated with negative outcomes, including lower educational achievement, increased rates of incarcerations, unemployment and illicit drug use (Faraone et al., 2015).

Validity and Reliability

The scale originally consisted of 61 items but the long form was reduced to the 25 items that showed the greatest mean difference between patients with ADHD and controls (Ward et al., 1993). The WURS-25 has a high level of internal consistency of 0.94 (Cronbach’s alpha; Kouros et al., 2018) and a higher score on the WURS-25 is associated with poorer performance on objective measures of attention (Mackin et al., 2005).

Brevik et al. (2020) performed a principal component analysis and confirmed a three-factor structure of the WURS as described in previous studies (Caci et al., 2010; Kouros et al., 2018; McCann et al., 2000; Stanton & Watson, 2016):

  1. Impulsivity & Behavioural problems (items 5, 6, 8, 10, 12, 13, 14, 15, 16, 19, 20, 21, 22)
  2. Inattentiveness & School problems (items 1, 4, 7, 17, 23, 24, 25)
  3. Self Esteem & Negative mood (items 2, 3, 9, 11, 18)

The WURS was administered to clinically diagnosed adult ADHD patients (n = 646) and to population controls (n = 908) to calculate percentiles using means and standard deviations (Brevik et al., 2020). The means (and standard deviations) were:

  • ADHD diagnosis: Mean = 58.2 (17.9)
  • Normative control: Mean = 17.3 (13.9)

Scoring and Interpretation

For the total score of the WURS-25, there is a cut score of 36 (sensitivity and specificity of 96%; Ward et al., 1993) and clients with scores of 36 or above have childhood symptoms that are consistent with adults who have an ADHD diagnosis. Normative and clinical percentiles are presented for the WURS-25 total score based upon administration to clinically diagnosed adult ADHD patients (n = 646) and to population controls (n = 908; Brevik et al., 2020). The means (and standard deviations) were:

  • ADHD diagnosis: Mean = 58.2 (17.9)
  • Normative control: Mean = 17.3 (13.9)

Raw and average scores are presented for the three subscales of the WURS-25:

  1. Impulsivity & Behavioural problems (items 5, 6, 8, 10, 12, 13, 14, 15, 16, 19, 20, 21, 22): a measure of problems with temper, outbursts, anger, and defiance issues as a child. 
  2. Inattentiveness & School problems (items 1, 4, 7, 17, 23, 24, 25): a measure of learning problems as a student and prominent issues with inattention as a child. 
  3. Self Esteem & Negative mood (items 2, 3, 9, 11, 18): a measure of excessive anxious, worrying, or unhappy moods as a child. 

The average scores for these subscales allows for a comparison between the childhood problem areas given they have differing numbers of questions within each subscale.

Developer

Ward, M. F., Wender, P. H., & Reimherr, F. W. (1993). The Wender Utah Rating Scale: an aid in the retrospective diagnosis of childhood attention deficit hyperactivity disorder. The American Journal of Psychiatry, 150(6), 885–890. https://doi.org/10.1176/ajp.150.6.885 

Reference

Brevik, E. J., Lundervold, A. J., Haavik, J., & Posserud, M.-B. (2020). Validity and accuracy of the Adult Attention-Deficit/Hyperactivity Disorder (ADHD) Self-Report Scale (ASRS) and the Wender Utah Rating Scale (WURS) symptom checklists in discriminating between adults with and without ADHD. Brain and Behavior, 10(6), e01605. https://doi.org/10.1002/brb3.1605

Caci, H. M., Bouchez, J., & Baylé, F. J. (2010). An aid for diagnosing attention-deficit/hyperactivity disorder at adulthood: Psychometric properties of the French versions of two Wender Utah Rating Scales (WURS-25 and WURS-K). Comprehensive Psychiatry, 51, 325–331.

Faraone, S. V., Asherson, P., Banaschewski, T., Biederman, J., Buitelaar, J. K., Ramos-Quiroga, J. A., … Franke, B. (2015). Attention-deficit/hyperactivity disorder. Nature Reviews Disease Primers, 1, 15020.

Kouros, I., Horberg, N., Ekselius, L., & Ramklint, M. (2018). Wender Utah Rating Scale-25 (WURS-25): Psychometric properties and diagnostic accuracy of the Swedish translation. Upsala Journal of Medical Sciences, 123, 230–236.

McCann, B. S., Scheele, L., Ward, N., & Roy-Byrne, P. (2000). Discriminant validity of the Wender Utah Rating Scale for attention-deficit/hyper-activity disorder in adults. The Journal of Neuropsychiatry and Clinical Neurosciences, 12(2), 240–24

Stanton, K., & Watson, D. (2016). An examination of the structure and construct validity of the Wender Utah Rating Scale. Journal of Personality Assessment, 98(5), 545–552.

Mackin, R. S., & Horner, M. D. (2005). Relationship of the Wender Utah Rating Scale to objective measures of attention. Comprehensive Psychiatry, 46(6), 468–471. https://doi.org/10.1016/j.comppsych.2005.03.004 

Depression Anxiety Stress Scale – Youth Version (DASS-Y)

$
0
0

The Depression Anxiety Stress Scales – Youth version (DASS-Y) is a version of the DASS-21 for youth aged 7 – 18 years of age designed to measure the negative emotional states of depression, anxiety and stress .

While the three symptom clusters measured by the DASS-Y share many characteristics with each other (i.e. general psychological distress), the DASS-Y emphasises the specific symptoms unique to each in order to better discriminate between depression, anxiety and stress, and thereby producing more independent subscales.

The DASS-Y is suitable for clinical settings to assess for symptoms of psychological distress and to monitor the course of those systems over time. In non-clinical settings the DASS-Y is useful as as a mental health screening questionnaire. The DASS-Y is based on a dimensional rather than a categorical conception of psychological problems, and scores emphasise the degree to which someone is experiencing symptoms rather than having diagnostic cutoff points. It is a useful tool for routine outcome monitoring and can be used to assess the level of treatment response.

Psychometric Properties

The DASS-Y was developed using a large sample of responses from 2,121 Australian students aged 7-18 (61% female). Confirmatory Factor Analysis was performed on a calibration group (half the sample) to test the 3-factor DASS model on 40 items previously developed in exploratory studies. The best-performing 21 items based on both statistical and theoretical considerations were then selected, guided by the structure and item content of the adult DASS. Responses were then cross-validated in the second half of the sample. Results indicated good fit for the final 21-item 3-factor DASS model in both groups of children and adolescents (Szabo & Lovibond, 2022).

Multiple regression analyses showed that when scores on the other DASS-Y scales were held constant, the Depression scale had a strong negative relationship with positive affect and life satisfaction, the Anxiety scale was strongly associated with physiological hyperarousal, and the Stress scale was associated with excessive worrying. However, the relationship between Stress and worrying was only evident from age 10 onwards (Szabo & Lovibond, 2022).

To assess the typical pattern of responding among young people, data was collected from a sample of primary school (aged 7 to 12, n=826) and high school (aged 13 to 18, n=1288) students, with the means and standard deviations split by age and gender and reported by Szabo and Lovibond (2022). Of note, significant gender differences were found in high school age students, whereby males reported lower overall scores, particularly on the stress subscale. The authors note that “due to systematic differences between the school groups, such differences need to be interpreted with caution.”

Scoring and Interpretation 

Scores are presented as a total score (between 0 and 63) and a score for the three subscales (between 0 and 21). In addition, percentiles for subscales are computed comparing results to age and gender related peers (Szabo & Lovibond, 2022).

Percentiles help contextualise scores in relation to age and gender relevant sample, whereby a percentile of 50 indicates the respondent scored at an average (and healthy) level compared to typical peers (shown by a dotted line on the graph). Higher percentiles indicate more symptoms, with a percentiles above 90, for example, indicating clinically significant psychological distress with more reported symptoms than 90 percent of peers.

Each of the three DASS-Y scales contains 7 items:

  • Depression: dysphoria, hopelessness, devaluation of life, self-deprecation, lack of interest / involvement, anhedonia and inertia. (Items 3, 5, 10, 13, 16, 17, 21)
  • Anxiety: autonomic arousal, skeletal muscle effects, situational anxiety, and subjective experience of anxious affect. (Items 2, 4, 7, 9, 15, 19, 20)
  • Stress: levels of chronic nonspecific arousal, difficulty relaxing, nervous arousal, and being easily upset / agitated, irritable / over-reactive and impatient. (Items 1, 6, 8, 11, 12, 14, 18)

A graph is produced on first administration showing percentiles compared to age related peers. When the DASS-Y is administered on two or more occasions the graph demonstrates the change in symptoms over time. Given the dimensional nature of psychological distress it is useful to consider even small changes in symptoms over time.

Developer

Szabo, M., & Lovibond, P. F. (2022). Development and Psychometric Properties of the DASS-Youth (DASS-Y): An Extension of the Depression Anxiety Stress Scales (DASS) to Adolescents and Children. Frontiers in Psychology, 13, 766890. https://doi.org/10.3389/fpsyg.2022.766890

Clinical Impairment Assessment Questionnaire (CIA)

$
0
0

The Clinical Impairment Assessment questionnaire (CIA) is a 16-item self-report measure of the severity of psychosocial impairment due to eating disorder features (Bohn and Fairburn, 2008). It focuses on the past 28 days. It was developed as a measure of functional impairment in domains of life that are typically affected by an eating disorder which includes mood and perception of self, cognitive functioning, interpersonal functioning, and work performance. It has been normed in adults 17-65 years of age. The CIA is intended to assist in the clinical assessment of patients both before and after treatment for eating disorders (Bohn et al, 2008).

The purpose of this scale is to provide a simple single index of the severity of the psychosocial impairment secondary to eating disorder features. It has been designed to be completed immediately after filling in a measure of eating disorder features that covers the same time frame such as the Eating Disorder Examination questionnaire, EDE-Q (Fairburn and Beglin, 2008). The reason for this being that the patient has the eating disorder features “front of mind” when filling in the CIA (Bohn & Fairburn, 2008).

The creators of the CIA recognised that the psychopathology of eating disorders not only needs to evaluate the nature and severity of the eating disorder features but also the importance of assessing the impact of these features on their psychosocial and physical functioning (Bohn et al., 2008). Eating disorders have profound effects on one’s psychosocial functioning. An example of this being that these patients’ over-evaluation of shape and weight has a marked effect on their ability to form and maintain interpersonal relationships. The CIA was developed to measure the profoundly negative impacts that an ED can have on a patient’s life. 

Psychometric Properties

The data for the CIA was collected from 123 of 170 patients who were participating in a transdiagnostic CBT trial based in two eating disorder clinics in the UK (Bohn et al., 2008). Participants for the study were included if they were 18-65 years old, had an eating disorder reviewed by an expert, and had a body mass index of between 16 and 40. Those with co-occurring clinical depression were excluded as their impairment might have been due to the depression rather than the eating disorder. Of the 123 patients included in the study, 8 had anorexia nervosa, 48 had bulimia nervosa, 67 had an eating disorder not otherwise specified.  

Each patient underwent a research assessment at the beginning and end of their treatment, and at 20, 40, 60, 104 and 208 weeks post-treatment. At each point they completed the EDE-Q and, immediately afterwards the CIA. At the same time there was a trained research assistant who administered an interview designed to identify secondary functional impairment. 

The Cronbach’s Alpha for the CIA was 0.97. The overall mean (SD) score was 20.1 (13.4) with a range of 0-47 (highest possible score is 48).  For the test-retest reliability, the mean (SD) scores of the 16-item CIA at times 1 and 2 were 10.56 (7.58) and 9.02 (8.18).  

The following means and SDs were found for the three subscales:

– Personal impairment M=10.2 (6.05)
– Social impairment  M=5.36 (4.58)
– Cognitive impairment  M=4.51 (4.0)

For construct validity, significant positive correlations were found between total scores on the 16-item CIA and scores on the EDE-Q (r = 0.89, p < 0.001) and the clinicians’ impairment ratings (r = 0.68, p < 0.001). These relationships were evident at each time point. 

The best cut-off point was a total CIA score of 16, which had a sensitivity of 76% and specificity of 86% (Bohn et al., 2008). 

Scoring and Interpretation 

Scores range from 0 to 48, with higher ratings indicate a higher level of impairment. A global CIA score is calculated to measure the overall severity of secondary psychological impairment, by adding together items and prorating items if 12 of 16 items have been rated. A global score of 16 represents clinically significant impairment (Bohn et al., 2008).

Clinical percentiles ranks are also presented, showing the scores in comparison to people with eating disorders (Anorexia, Bulimia and Eating Disorder Not Otherwise Specified; Bohn et al., 2008). Higher percentiles indicate more impairment. Scores at or above the 38th percentile indicate clinically significant impairments (as defined by raw score = 16), and indicates that the respondent scored higher than 38 percentile of people with an eating disorder. This cutoff is represented by a dotted line on the graph. 

Three sub-scales are computed, representing different areas of impairment that can result from eating disorders:

– Personal impairment  (Items 2, 8, 9, 11, 14, 16)
– Social impairment (items 3, 7, 10, 12, 15)
– Cognitive impairment (Items 1, 4, 5, 6, 13)

Note. Question 4 is optional and as the percentiles are based upon a complete score (with no missing items), if the client does not complete this question then the missing value is imputed by calculating the average of the total score or the cognitive impairment subscale (the two scores that depend on a value for question 4) and this value is added to provide a total and subscale total, respectfully. Although this imputation method will provide a valid result for these scores if question 4 is left blank, the scores and percentiles should then be interpreted with some caution.

Developer

Bohn, K., Doll, H. A., Cooper, Z., O’Connor, M., Palmer, R. L., & Fairburn, C. G. (2008). The measurement of impairment due to eating disorder psychopathology. Behaviour research and therapy, 46(10), 1105-1110.

Bohn K, & Fairburn CG. (2008). Clinical Impairment Assessment Questionnaire (CIA 3.0). In Fairburn CG. Cognitive Behavior Therapy and Eating Disorders. New York: Guilford Press.

References

Bohn, K., Doll, H. A., Cooper, Z., O’Connor, M., Palmer, R. L., & Fairburn, C. G. (2008). The measurement of impairment due to eating disorder psychopathology. Behaviour research and therapy, 46(10), 1105-1110.

Fairburn CG, & Beglin SJ. (2008). Eating Disorder Examination Questionnaire (6.0). In Fairburn CG. Cognitive Behavior Therapy and Eating Disorders. New York: Guilford Press. 

Jenkins, P. E. (2013). Psychometric validation of the Clinical Impairment Assessment in a UK eating disorder service. Eating behaviors, 14(2), 241-243.

Regensburg Insomnia Scale (RIS)

$
0
0

The Regensburg Insomnia Rating Scale (RIS) is a 10-item rating scale to assess the cognitive, behavioural, and emotional aspects of psychophysiological insomnia (PI; Crönlein et al., 2013). The scale has been validated in an adult population.

Psychophysiological insomnia is a form of primary insomnia and is defined by International Classifications of Sleep Disorders (ICSD-2) as a state of “heightened arousal and learned sleep preventing associations that result in a complaint of insomnia and associated decreased functioning during wakefulness.”

The specific criteria include difficulty in initiating or maintaining sleep, waking up too early, or sleep that is non-restorative or of poor quality. The sleep difficulties described above occur despite ample opportunity and circumstances for sleep, the symptoms are present for at least 1 month, and there is evidence of conditioned sleep difficulty and/or heightened arousal in bed (Perlis, and Gehrman, 2013).

There have been several tools developed for the assessment of insomnia, however many do not target the psychological symptoms of insomnia or are too specific for routine clinical screening, as they measure only certain symptoms of insomnia such as pre-sleep worrying or one’s arousal state before sleep. The RIS was developed as a short scale that covers both the quantitative and qualitative aspects of sleep. It also measures four factors of sleep:

1. Poor Sleep Depth
2. Poor Sleep Quantity
3. Fearful Focus on Insomnia
4. Hypnotics and Poor Daytime Functioning

Psychometric Properties

The RIS was originally designed in Germany, where sleep experts compiled a list of typical complaints of psychophysiological insomnia (PI) patients, with emphasis put on the exact wording – such as “I wake up from the slightest sound.” To identify the items that were specific to PI, the list was given to patients with sleep apnoea (N=33), PI (N=36) and healthy controls (N=29; Cronlein et al., 2013). Items that did not discriminate between PI patients and the other two groups were excluded. From the items that remained, the list was further shortened to cover both qualitative and quantitative sleep parameters in a short scale.

After the RIS was constructed, the psychometric properties were investigated in two separate samples of patients with PI, one sample was used for the normative data, and the second group were tested pre and post cognitive behaviour therapy for insomnia (CBT-i; Cronlein et al., 2013). The inclusion criteria for this study was a diagnosis of PI irrespective of the use of hypnotics. Exclusion criteria was current or past continuous shift work, and a current severe physical or mental disorder that had a major influence on sleep. To assess specificity and sensitivity, a sample of 94 healthy controls was also included. The Normative Group, consisted of 218 PI patients with a mean age of 48.9, and mean duration of insomnia symptoms of 9.5 years. All patients were seeking help in a specialised sleep centre. The therapy group consisted of 38 PI patients who participated in a standardised CBT-i group.

The mean total RIS score for the sample was 22.6 with a standard deviation of 5.19, which was significantly higher than the score of the control group.

A RSI cut-off score of more than 12 has a sensitivity was 97.7% for PI patients and specificity was 97.9% for the healthy control sample. Cronbach’s Alpha was .89 for the whole sample. There was high concurrent validity with the Pittsburgh Sleep Quality Index (PSQI). The RIS is sensitive to improvements after CBT-i, with all items improving except “sleep duration”.

Cronlein et al. (2013) found that there were four factors for the RSI:

1. Poor Sleep Depth – 20% of the variance
2. Poor Sleep Quantity – 19% of the variance
3. Fearful Focus on Insomnia – 15% of the variance
4. Hypnotics and Poor Daytime Functioning – 12% of the variance

Scoring and Interpretation 

Total scores range from 0 to 40 points with higher scores indicative of more cognitive, behavioural, and emotional difficulties consistent with psychophysiological insomnia. Scores from 0-12 are considered normal and scores above the cutoff (13+) are indicative of symptoms consistant with psychophysiological insomnia that warrant further investigation.

A clinical percentile is shows a comparison of the total score of the respondent’s in comparison to patients with diagnosed psychophysiological insomnia (Cronlein et al., 2013). A clinical percentile of around 50 indicated that a client has scored at the average level for the clinical comparison group and would be indicative of significant cognitive, behavioural, and emotional symptoms consistent with psychophysiological insomnia.

There are four factors for the RSI:

1. Poor Sleep Depth (items 3, 4, 5) – measuring sleep continuity, easy awakening, and early awakening.
2. Poor Sleep Quantity (items 1, 2, 6) – measuring sleep latency, sleep duration, and sleepless nights.
3. Fearful Focus on Insomnia (items 7, 8) – measuring thinking about sleep and fear of insomnia.
4. Hypnotics and Poor Daytime Functioning (items 9, 10) – measuring impaired daytime fitness and hypnotics intake.

Average scores are presented for the four factors so that a comparison can be made (due to different numbers of questions in each factor) and which allows a comparison of relative strengths and weaknesses in the sleep factor areas (with higher average scores indicating more difficulties).

The RIS can be used to monitor the effectiveness of sleep interventions such as CBT-i.

Developer

Crönlein, T., Langguth, B., Popp, R., Lukesch, H., Pieh, C., Hajak, G., & Geisler, P. (2013). Regensburg Insomnia Scale (RIS): a new short rating scale for the assessment of psychological symptoms and sleep in insomnia; study design: development and validation of a new short self-rating scale in a sample of 218 patients suffering from insomnia and 94 healthy controls. Health and quality of life outcomes, 11(1), 1-8.

References

Crönlein, T., Langguth, B., Popp, R., Lukesch, H., Pieh, C., Hajak, G., & Geisler, P. (2013). Regensburg Insomnia Scale (RIS): a new short rating scale for the assessment of psychological symptoms and sleep in insomnia; study design: development and validation of a new short self-rating scale in a sample of 218 patients suffering from insomnia and 94 healthy controls. Health and quality of life outcomes, 11(1), 1-8.

Perlis, M., & Gehrman, P. (2013). Psychophysiological insomnia. the behavioural model and a neurocognitive perspective, 1997, 6.

Morin CM. Insomnia: Psychological assessment and management: Guilford press; 1993.

Short Health Anxiety Inventory (SHAI)

$
0
0

The Short Health Anxiety Inventory (SHAI) contains 18 items that assess health anxiety independent of physical health status.

Items assess worry about one’s health, awareness of bodily sensations and/or changes, and the feared consequences of having an illness (Salkovskis et al., 2002). It can be used in both healthy individuals and physically ill individuals including those who were temporarily sick or diagnosed with a serious and/or chronic illness.

Worries about health are a normal human experience, and thought to fall along a continuum in the general population (Salkovskis and Warwick, 2001). Towards the upper end of the continuum, individuals are likely to experience and obsessional fear of illness and may fall in the realm of health anxiety. Health Anxiety (now referred to as Illness Anxiety Disorder in the DSM-5-TR and previously known as hypochondriasis) refers to inappropriate or excessive fears about one’s health. It is characterised by excessive fears or beliefs that one has a serious illness, and this is often based on the misinterpretation of bodily sensations or symptoms.

Health anxiety consists of distressing emotions (such as fear) due to thoughts of danger and physiological arousal (Taylor, & Asmundson, 2004). This anxiety is often maintained by behaviours that individuals use to decrease distress however inadvertently increase or maintain physical symptoms of anxiety (Haig-Ferguson et al., 2021). Health anxiety has also been conceptualised to offer a unifying perspective on the fears symptoms worsening or returning commonly experienced by those living with chronic disease (Lebel et al., 2020; Haig-Ferguson et al., 2021).

Psychometric Properties

Salkovskis, Rimes, Warwick, and Clark (2002) developed the Health Anxiety Inventory (HAI; 64 items) and a shortened version of this scale, the Short Health Anxiety Inventory (SHAI; 18 items), to be sensitive to both normal levels of health concern and severe health anxiety.

The scale was validated in clinical and non-clinical samples, 24 diagnosed with hypochondriasis, 19 anxious controls (panic disorder or social anxiety), 107 women attending a general practice clinic, 267 people attending gastroenterology department, 97 attending MRI scan, 190 non-anxious controls and 66 students. These samples yielded the following means and standard deviates.
– Hypochondriasis patients – 37.9 (SD=6.8)
– Anxious control -18.5 (SD=7.3)
– Controls 12.2 (SD=6.2)
– Students 12.6 (SD=5.0)
– Women in GP clinic 14.5 (SD=5.9)
– Gastroenterology clinic 13.9 (SD=7.4)

Another study found the mean score for SHAI in non-clinical sample with 467 undergraduate students was 10.79 (SD = 6.38) (Abramowitz et al., 2007).

A systematic review and meta-analysis of the SHAI concluded that it was a psychometrically sound tool for assessing health anxiety across non-clinical, clinical, and medical samples (Alberts et al., 2013).

The SHAI has good to excellent internal consistency (= .74–.96) across 16 studies (Alberts et al., 2013). It has sound factorial,, convergent, divergent and criterion validity (Alberts et al., 2013). However, test re-test reliability of the SHAI was reported in only one study by Olatunji et al. (2011) and was found to be adequate (r = .87) when administered over four administrations across a 3-week study period.

The SHAI has also been shown to be sensitive to treatment effects with CBT for severe health anxiety (Williams et al., 2011; Hedman et al., 2011).

Scoring and Interpretation 

Scores consist of a total (range = 0 to 54) and scores for two subscales:

– Health Anxiety (items 1-14, range 0 to 42) which measures anxiety related to health

– Negative Consequences’ of becoming ill (items 15-18, range 0 to 12).

Higher scores indicate more health anxiety and beliefs of negative consequences of becoming ill.

Two percentiles are computed that compares scores against two samples (Salkovskis, Rimes, Warwick & Clark, 2002).

– A Normative Percentile compares the respondent’s scores against patterns of responding in a community sample. A Normative Percentile of around 50 represents an average (and healthy) level of concern about health. Higher percentiles indicate higher levels of concern over health. Those with Illness Anxiety Disorder will typically have a Normative Percentile above 99, indicating they score above 99% of the community.

– A Clinical Percentile is also computed, indicating how the respondent scored in comparison to people who had been independently assessed as having Health Anxiety Disorder (previously known as hypochondriasis).

If the SHAI is administered on more than one occasion, the total score will be graphed over time with a dotted horizontal line displayed at the community average score. The SHAI is sensitive to treatment effects, it is also a useful measure of the effectiveness of treatment for health anxiety.

Developer

Salkovskis, P. M., Rimes, K. A., Warwick, H. M. C., & Clark, D. M. (2002). The Health Anxiety Inventory: development and validation of scales for the measurement of health anxiety and hypochondriasis. Psychological Medicine, 32(05), 843-853.

References

Haig-Ferguson, A., Cooper, K., Cartwright, E., Loades, M. E., & Daniels, J. (2021). Practitioner review: Health anxiety in children and young people in the context of the COVID-19 pandemic. Behavioural and cognitive psychotherapy, 49(2), 129-143.

Hedman, E., Andersson, G., Andersson, E., Ljotsson, B., Rück, C., Asmundson, G. J., & Lindefors, N. (2011). Internet-based cognitive–behavioural therapy for severe health anxiety: randomised controlled trial. The British Journal of Psychiatry, 198(3), 230-236.

Lebel, S., Mutsaers, B., Tomei, C., Leclair, C.S., Jones, G., Petricone-Westwood, D., Rutkowski, N., Ta, V., Trudel, G., Laflamme, S.Z. and Lavigne, A.A. (2020). Health anxiety and illness-related fears across diverse chronic illnesses: A systematic review on conceptualization, measurement, prevalence, course, and correlates. Plos one, 15(7), e0234124.

Olatunji, B. O., Etzel, E. N., Tomarken, A. J., Ciesielski, B. G., & Deacon, B. (2011). The effects of safety behaviors on health anxiety: An experimental investigation. Behaviour research and therapy, 49(11), 719-728.

Taylor, S., Asmundson, G. J., & Hyprochondria. (2004). Treating health anxiety: A cognitive-behavioral approach (Vol. 494, p. 495). New York: Guilford Press.

Williams, M. J., McManus, F., Muse, K., & Williams, J. M. G. (2011). Mindfulness‐based cognitive therapy for severe health anxiety (hypochondriasis): An interpretative phenomenological analysis of patients’ experiences. British Journal of Clinical Psychology, 50(4), 379-397.

Viewing all 314 articles
Browse latest View live


Latest Images